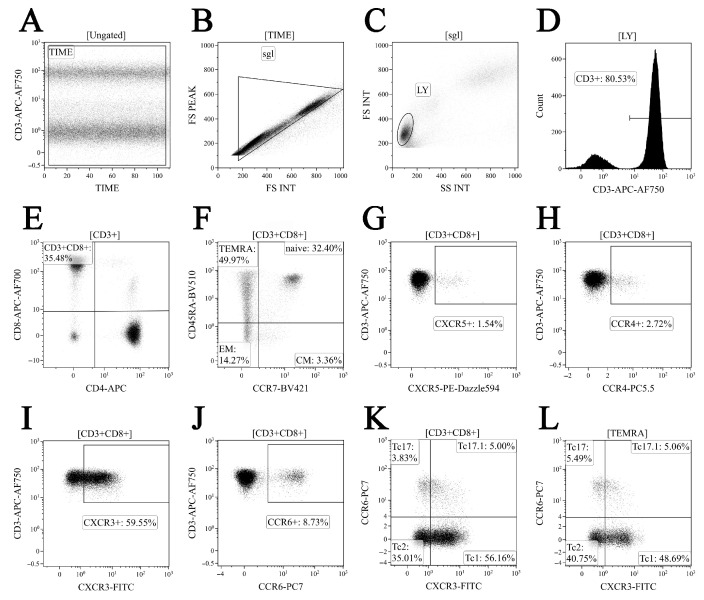
Figure 2.
Gating and analysis strategy for ‘polarized’ CD8+ T cell subsets immunophenotyping using flow cytometry. Dot plot (A)—artifact exclusion included time gating; dot plot (B)—doublets exclusion from the analysis using the ratio between integral and peak forward scatter signals; dot plot (C)—total lymphocyte subset purification based on side scatter and forward scatter; dot plot (D)—total T cell subset gaiting based on CD3 expression; dot plot (E)—detection of CD8+ T cells within total CD3+ T cell subset; dot plot (F)—identification of four main CD8+ T cell maturation subsets: ‘naïve’, central memory (CM), effector memory (EM), and TEMRA CD8+ T cells; dot plots (G–L)—examples of CXCR5, CCR4, CXCR3, and CCR expression by total CD8+ T cells; dot plots—examples of Tc1 (CCR6−CXCR3+), Tc2 (CCR6−CXCR3−), Tc17 (CCR6+CXCR3−), and double-positive Tc17.1 (CCR6+CXCR3+) detection within total CD8+ T cell subset and TEMRA CD8+ T cell, respectively.

