
Figure 2. Identification of cell-specific gene clusters in whole-brain transcriptomes by two-step hierarchical clustering.
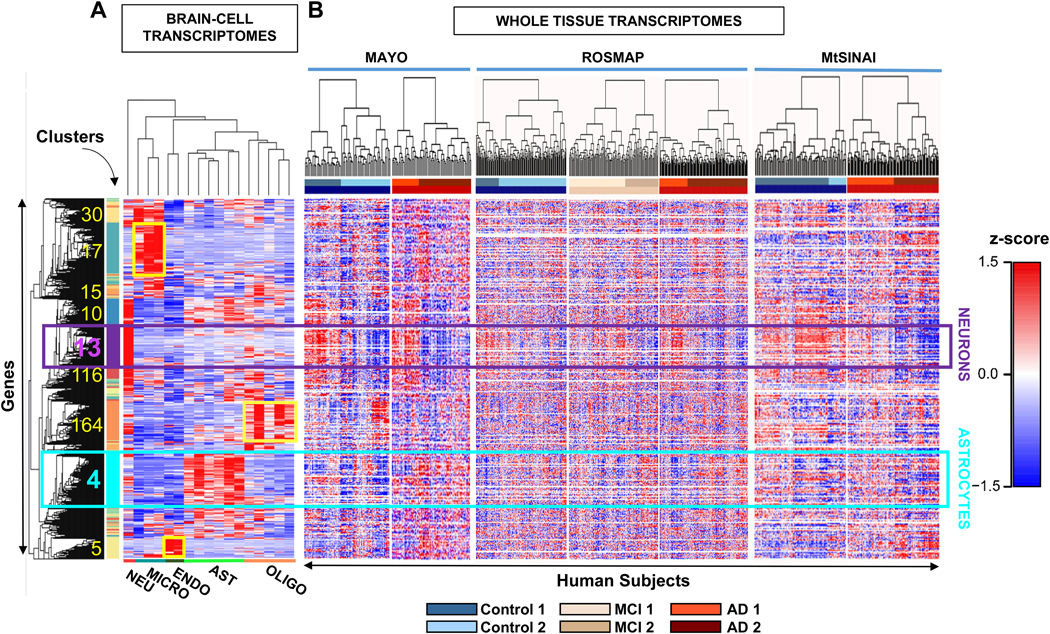
A. Hierarchical clustering was performed on transcriptomes of brain cell populations isolated from individual healthy subjects. Each column is a sample from a single subject and each row is a z-scored gene. In squares, the number and location of clusters with the highest z scores, that coincide with the highest τ scores for a given cell type (cluster information in Supplementary file 1, tabs 6-8). The turquoise and purple squares are the main astrocytic and neuronal clusters (cluster # 4 and cluster # 13), respectively. Microglia, oligodendrocyte, and endothelial-cell clusters are 17, 164 and 5, respectively (shown in yellow). Clusters 30, 15, 10 and 116 are highly enriched in microglial or neuronal genes, but fall below the criteria established for cell-specificity (Methods).
B. Whole-brain transcriptomes from individual subjects of Control (blue), MCI (beige) and AD (red) groups from MAYO, ROSMAP, MtSINAI were hierarchically clustered. The rows from the cell-type clustering in A. were kept fixed to identify cell-specific clusters. The figure was generated with raw data before correction for cell composition. The clustering segregated all groups with the same clinical diagnosis into at least 2 subgroups (defined as 1 and 2) showing opposite changes in geneexpression.