
Figure 3. Neuronal and astrocytic gene sub-clusters in the three clinical databases.
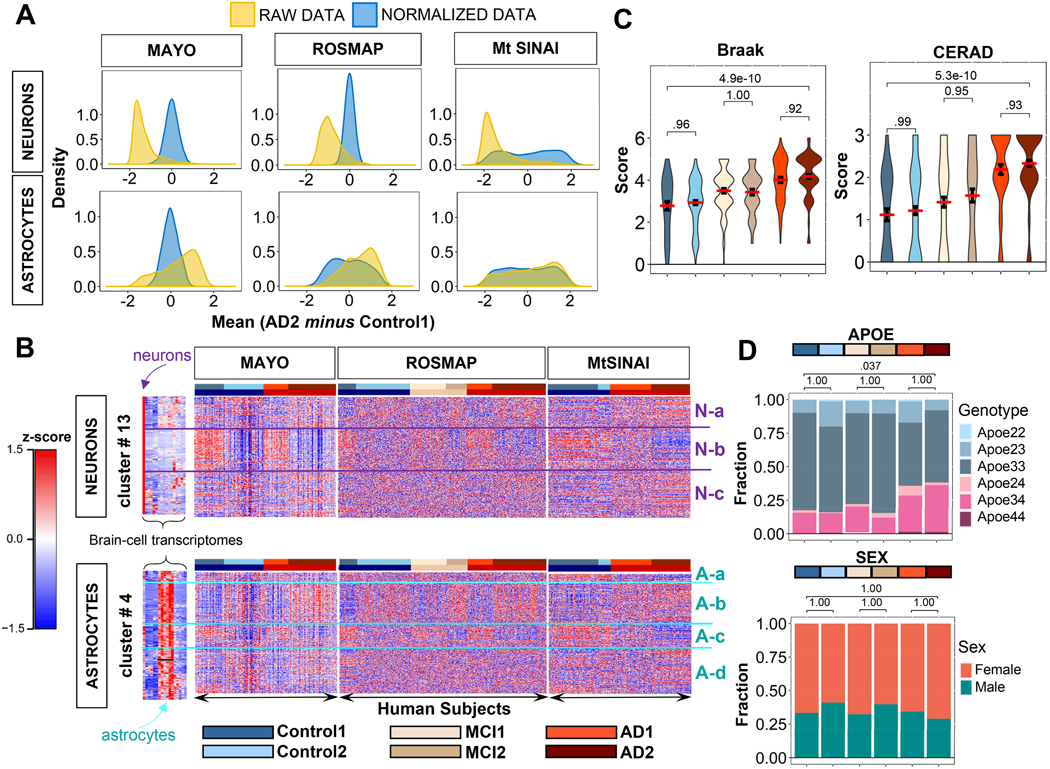
A. Distributions of gene expression differences between AD2 and Control1 cohorts before (yellow) and after (blue) variance stabilizing normalization, yielding zero-centered distributions (Methods).
B. Hierarchical clustering of Control (blue), MCI (beige), and AD (red) subjects from Fig. 2B using normalized data in rows. For both astrocytic and neuronal genes, subjects self-organized into at least two distinct subgroups (defined as 1 and 2) within each group with the same clinical diagnosis, while genes self-organized into up to four groups (Na-c and Aa-d). In MAYO and ROSMAP, clusters showed opposite directions of change in type 1 and 2 subjects. In MtSINAI, Control2 was like Control1, and AD1 like AD2, although with less pronounced changes.
C. Violin plots of pathological stages according to CERAD and Braak scoring shows no significant difference in pathological stages between sub-groups within each cohort in ROSMAP (means ± SEM, one-way ANOVA with Tukey post-hoc).
D. Distribution of APOE genotypes and sex in the six groups. While 3/3 was the predominant genotype across all groups, and 3/4 was more abundant in AD, there were no differences in frequency of APOE4 alleles between type 1 and 2 subgroups of subjects with the same clinical diagnosis. Likewise, females were more abundant than males in all groups, but not in type 2 subjects as compared to type 1 (p values determined by pairwise Fisher’s Exact test with Bonferroni adjustment).