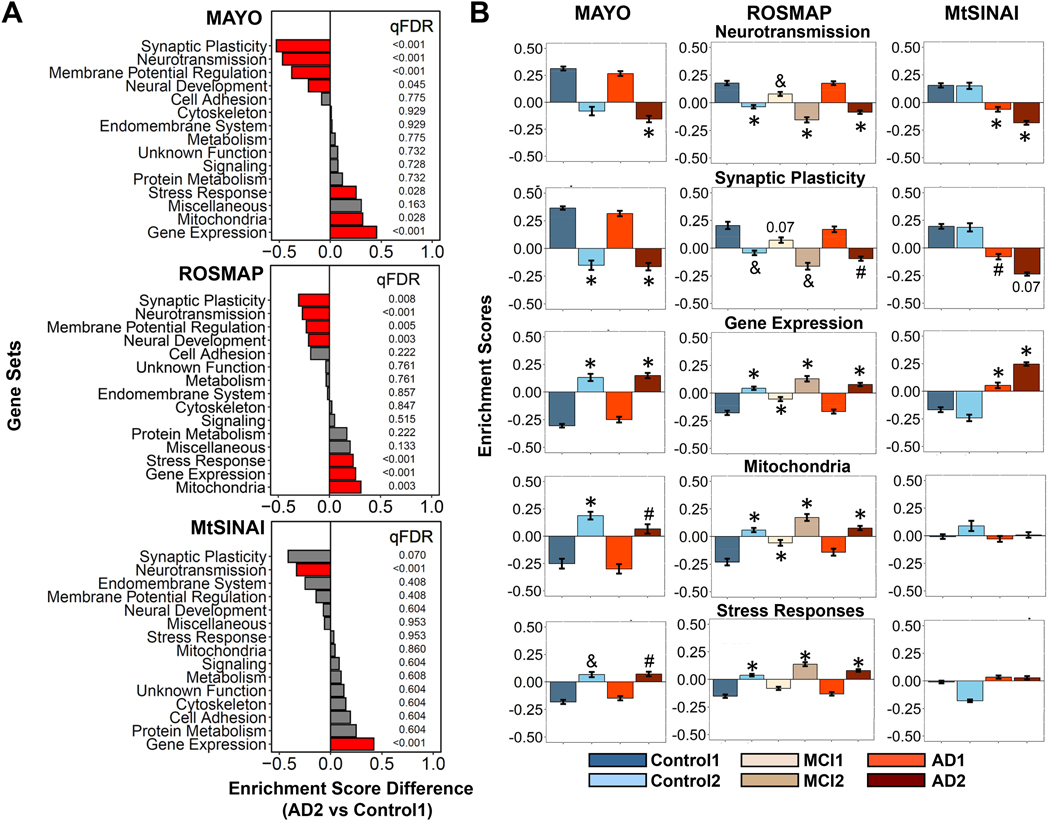
Figure 4. GSVA unravels neuron-enriched functions altered in AD.
Differences in the general functional categories among cohorts in MAYO, ROSMAP and MtSINAI databases were examined by GSVA.
A. Comparison between AD2 and Control1. Functions are ranked according to the difference in enrichment scores (ES). Significantly changed functions (qFDR < 0.05) are labeled in red.
B. Enrichment scores of functional categories significantly changed in at least 2 out of 3 databases. (#) qFDR< 0.05 (&) qFDR <0.01, and (*) qFDR < 0.001, vs Control1.

