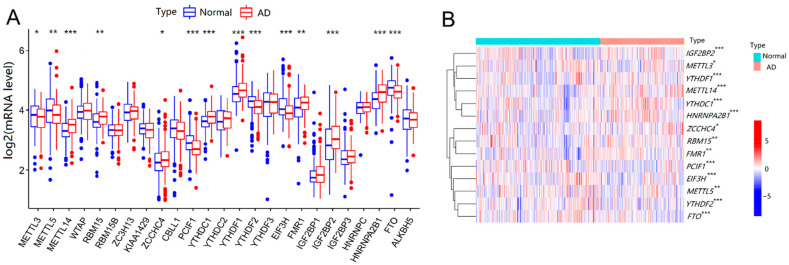
Figure 1.
Expressions of m6A methylation regulators between normal controls and AD patients. (A) Differential expression boxplot of the 25 identified m6A regulators. (B) Expression heat map of 14 differential m6A regulators. The t-test was used to analyze the difference in the expression levels of m6A regulators. Compared with the controls, * p < 0.05, ** p < 0.01, and *** p < 0.001.

