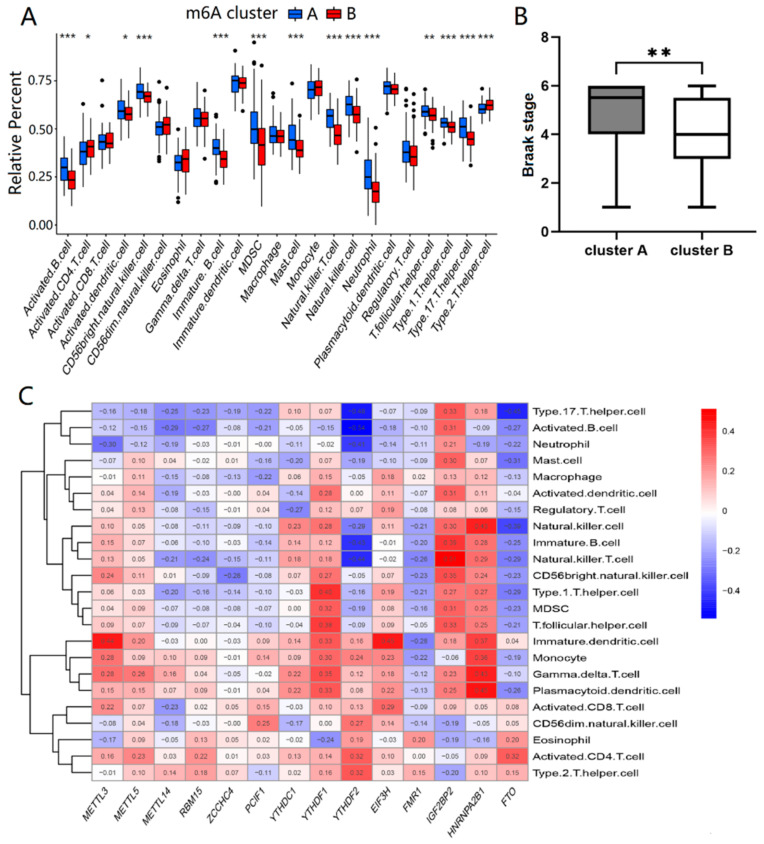
Figure 3.
Immune infiltration and Braak staging of two different m6A patterns. (A) The t-test was performed to analyze the differential immune infiltrating cells between cluster A and cluster B. (B) The Wilcoxon rank sum test was performed to compare the Braak stage differences between cluster A and cluster B. (C) The correlation between infiltrating immune cells and the 14 significant m6A regulators was assessed by Pearson’s test. The results with significant difference were marked as * p < 0.05, ** p < 0.01, and *** p < 0.001.

