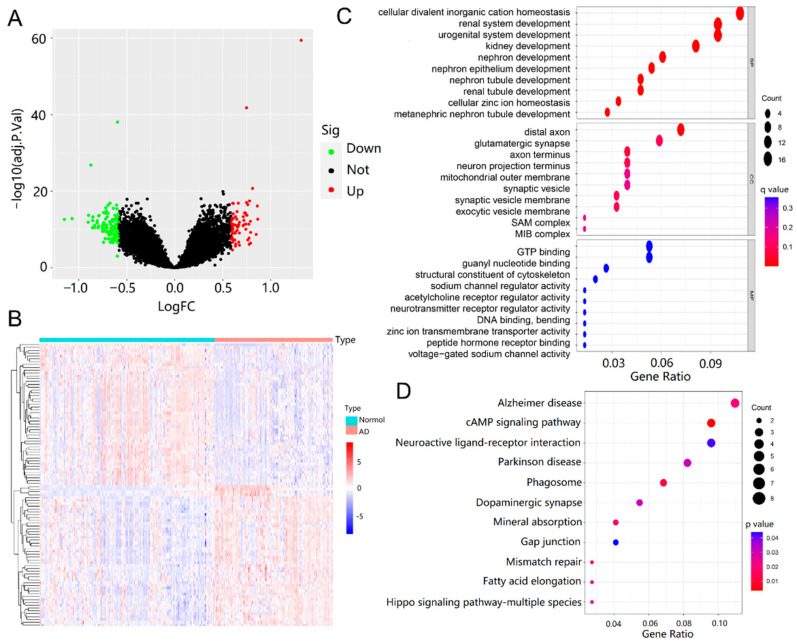
Figure 4.
Screening and functional enrichment analysis of DEGs. (A) Volcano plot of DEGs (|log2FC| > 0.585 and FDR < 0.05). Up-regulated genes are colored in red and down-regulated genes are colored in green. (B) Heatmap of top 70 up and top 124 down DEGs of AD. (C) GO enrichment analysis of DEGs (p < 0.05 and q < 0.05). (D) KEGG pathway enrichment results for DEGs (p < 0.05 and q < 1).

