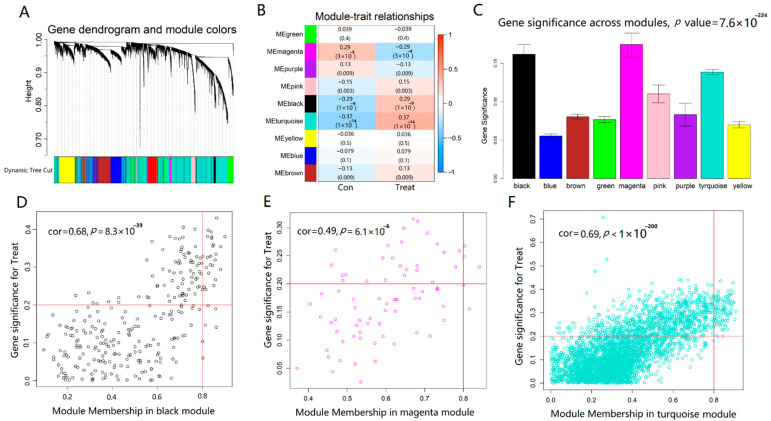
Figure 5.
Identification of modules associated with AD through WGCNA. (A) Dendrogram of all differentially expressed genes clustered based on a dissimilarity measure. (B) Heatmap of the correlation between module eigengenes and AD. Each cell contained the correlation coefficient and p value. (C) Distribution of average gene significance and errors in the modules associated with AD. (D–F) Module trait relationship and module features of GS and MM. Every point defined a specific gene within every module that was plotted on the y-axis and the x-axis by GS and MM, respectively.

