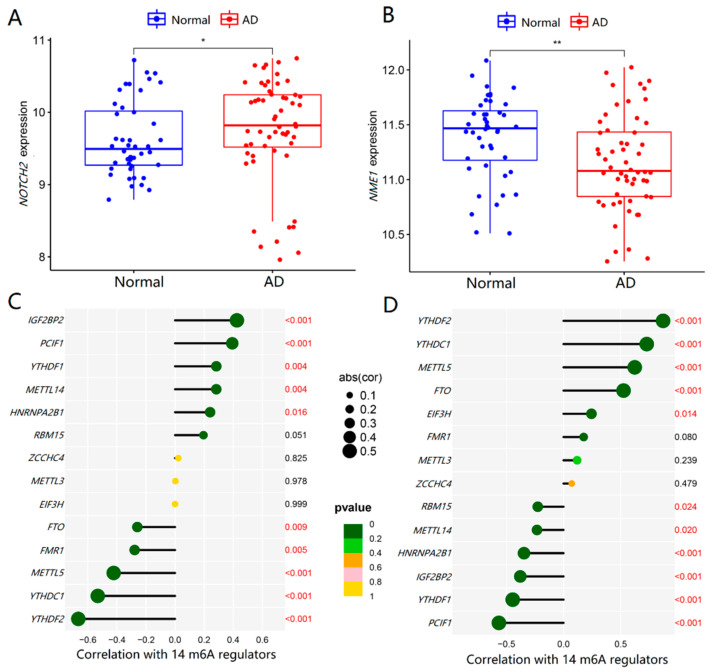
Figure 8.
Validation of NOTCH2 and NME1 expression in AD and their relationships with m6A regulators. (A,B) The t-test was conducted to analyze the differences in the expression of NOTCH2 and NME1 between normal controls and AD patients by using the validation dataset GSE122063. (C,D) The Pearson’s test was performed to analyze the correlations between NOTCH2 and NME1 and m6A regulators. The results with significant differences were marked as * p < 0.05 and ** p < 0.01.

