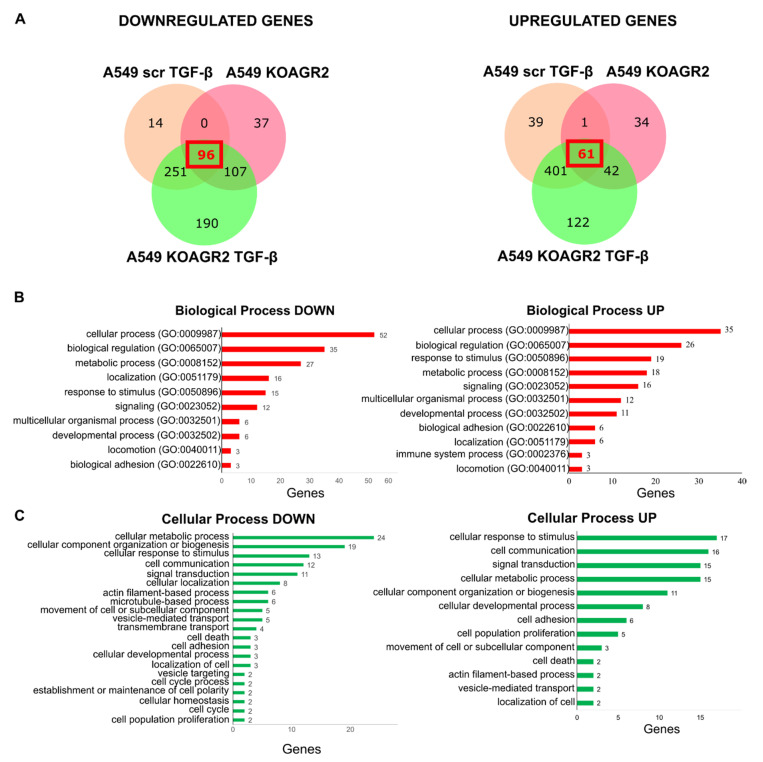
Figure 1.
Evaluation of gene expression changes with respect to particular biological processes using the Protein Analysis Through Evolutionary Relationships database (PANTHER visualization tools). (A) Venn diagrams for overlapping genes with significantly decreased (left) or increased (right) expression in comparison with A549 scr cells. (B,C) GO enrichment analysis of biological processes (red graphs) and cellular processes (green graphs) associated with downregulated (left) and upregulated (right) genes common to all three categories.

