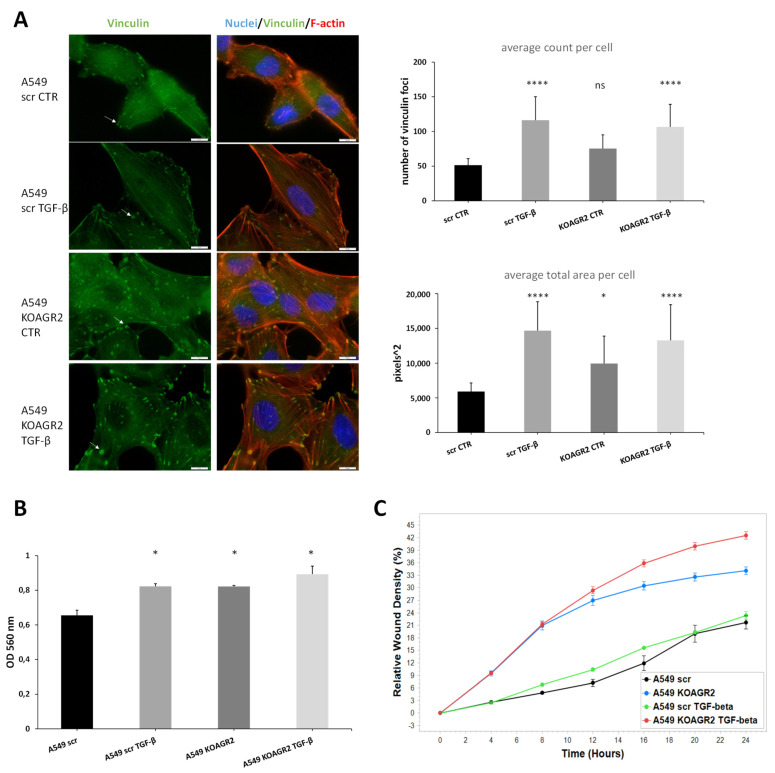
Figure 3.
(A) Representative immunofluorescence of F-actin stress fibres (red) and vinculin foci (green). Nuclei are stained in blue by Hoechst. Slides were captured at 100× magnification and the scale bar represents 10 μm. Graphs show quantification of Vinculin foci either as average count per cell or average area taken up by foci per cell in pixels squared. Quantification was performed according to Horzum et al. [56]. (B) Analysis of invasion potential of A549 using transwell assay. (C) Analysis of migratory properties by wound healing assay using IncuCyte. The migratory rate is expressed as the relative wound density in % and is the highest in cells with AGR2 knockout. * p < 0.05; **** p < 0.0001; ns (non-significant).

