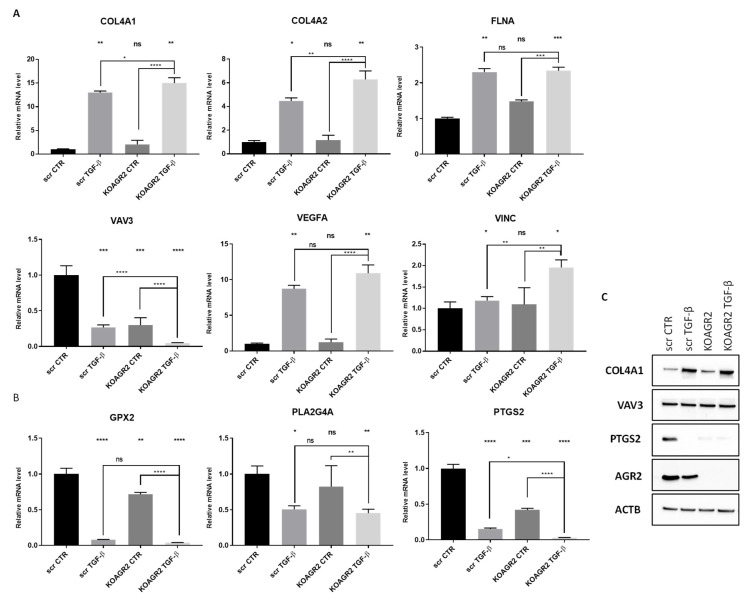
Figure 4.
Validation of mRNA levels of representative genes by RT-qPCR for (A) focal adhesion pathway and (B) arachidonic acid metabolism pathway. Graphs show gene expression normalized to GAPDH as an endogenous control. In parallel, another two endogenous controls, 18S rRNA and HPRT1, were used with similar outputs. * p < 0.05; ** p < 0.01; *** p < 0.001; **** p < 0.0001; ns (non-significant). (C) Representative immunochemical analysis of COL4A1, VAV3, PTGS2, and AGR2. Beta-actin served as loading control.

