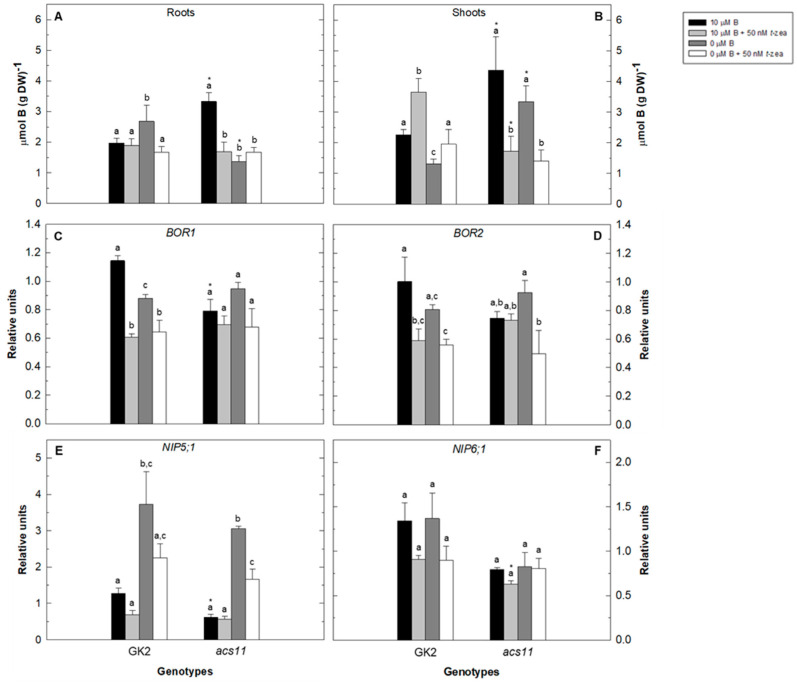
Figure 5.
Effect of cytokinin treatment on total B content and gene expression of B transporters of Arabidopsis wild type (GK2) and acs11 mutant under B deficiency. Total B content was measured in roots (A) and shoots (B) in Arabidopsis wild type (GK2) and acs11 mutant grown in control (black bars), control plus 50 nM trans-zeatin (light grey bars), B-deficient (dark grey bars), and B-deficient plus 50 nM trans-zeatin (white bars) treatment after 48 h. Quantitative RT-PCR analysis of BOR1 (C), BOR2 (D), NIP5;1 (E), and NIP6;1 (F) transcript levels in roots were measured in the same treatments. Results are given as means ± SD (n = 3 separate pools). Different letters indicate statistically significant differences between treatments for each genotype according to ANOVA with Tukey’s HSD test (p < 0.05). Asterisks indicate statistically significant differences between genotypes for each treatment according to Student’s t-test (p < 0.05).

