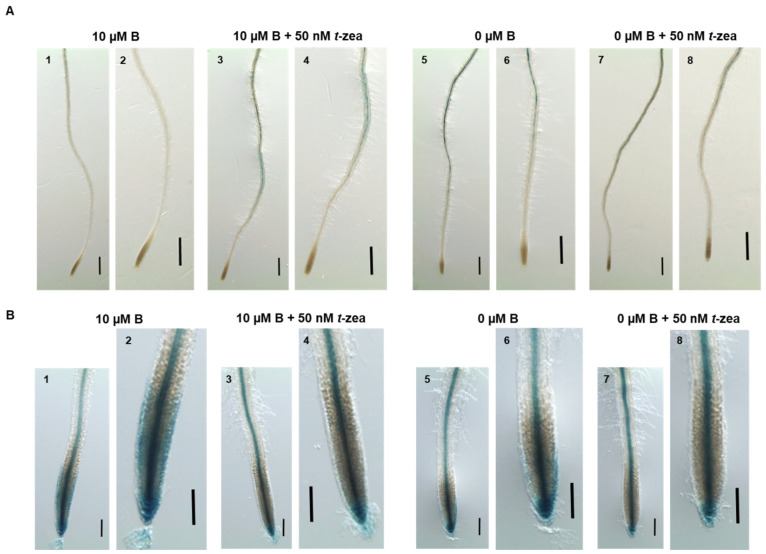
Figure 8.
GUS expression in the roots of EBS::GUS (A) and IAA2::GUS (B) seedlings grown in control (10 μM B) or B-deficient (0 μM B) medium in the presence or absence of trans-zeatin 50 nM for 48 h. Images in detail are shown in the respective right sides. Images are representative individuals from two independent experiments, with at least 17 seedlings examined for each experiment. Scale bar of EBS::GUS = 500 μm, and scale bar of IAA2::GUS = 100 μm.

