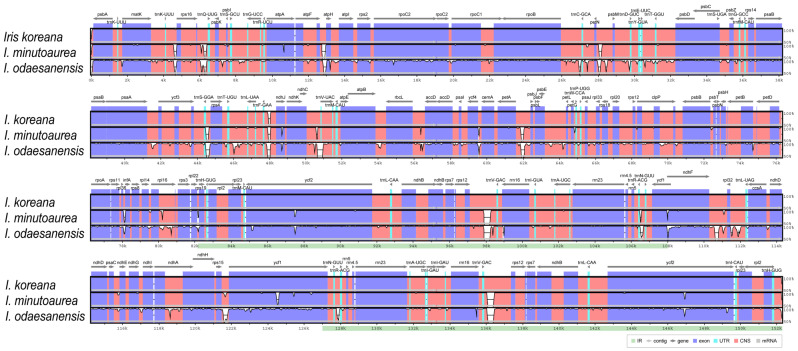
Figure 5.
Visualization of the comparison of the three Iris cp genomes using mVISTA, with I. koreana as the reference. Different colors represent different coding and non-coding gene regions. Dark-blue blocks: conserved genes, light-blue blocks: transfer RNAs (tRNAs) and ribosomal RNAs (rRNAs), red blocks: conserved non-coding sequences (CNS). The vertical scale with white represents the regions with higher levels of sequence variations within the chloroplast genome.

