Figure 4.

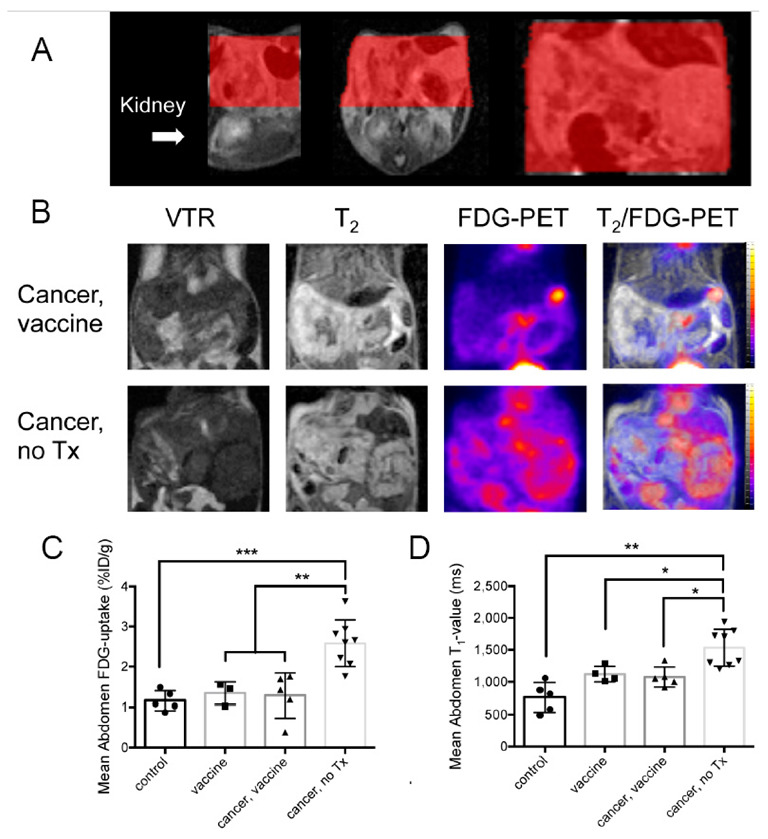
Quantification of abdominal [18F]FDG uptake using PET and T1-values from MRI. (A) T2 images were used to create regions of interest (ROI) for quantification of [18F]FDG-PET and T1-map signals. From left to right, sagittal, axial/transverse, and coronal slices are shown. Abdominal ROIs are shown in red. (B) Representative images from abdominal coronal slices include the variable T1–map (TR = 800), T2, [18F]FDG-PET, and T2/ [18F]FDG-PET combined in cancer-challenged vaccinated (top) or untreated (bottom) mice. (C) Quantification of the abdominal [18F]FDG-PET signal (%ID/g) by treatment group. (D) Quantification of T1-values using T1-maps. Statistical comparison was performed by Ordinary (PET) or Welch (MRI) ANOVA with Tukey’s or Dunnett’s T3 for multiple comparisons, respectively. The comparisons were significantly different as indicated by * p ≤ 0.05, ** p ≤ 0.01, and *** p ≤ 0.001.
