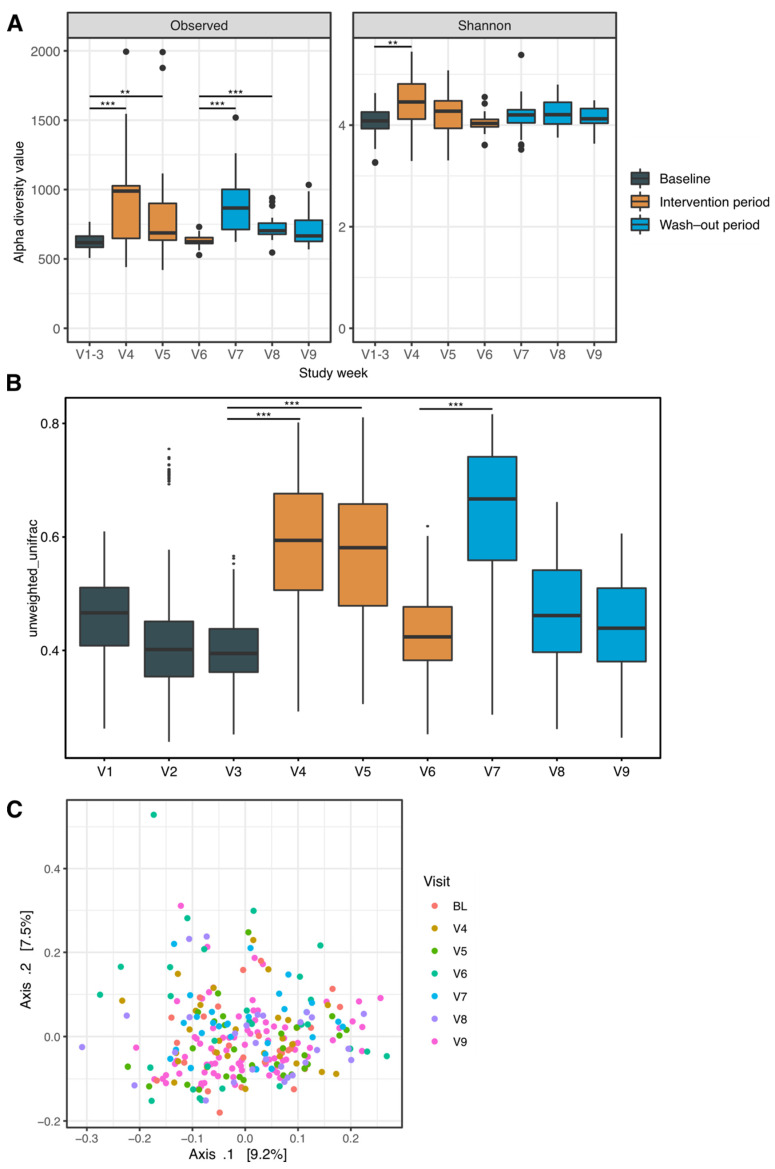
Figure 3.
Microbial ecology measures of diversity. (A) α-diversity—describing intra-group diversity, i.e., the number of observed species—and Shannon indices. (B,C) β-diversity as unweighted Unifrac values by study week (B) and a Principal Coordinate Analysis of unweighted Unifrac distances (C). Statistical comparisons were made using pairwise Wilcoxon tests between the median of the baseline values (weeks 1–3) and the subsequent weeks. p values ** < 0.01, *** < 0.001.

