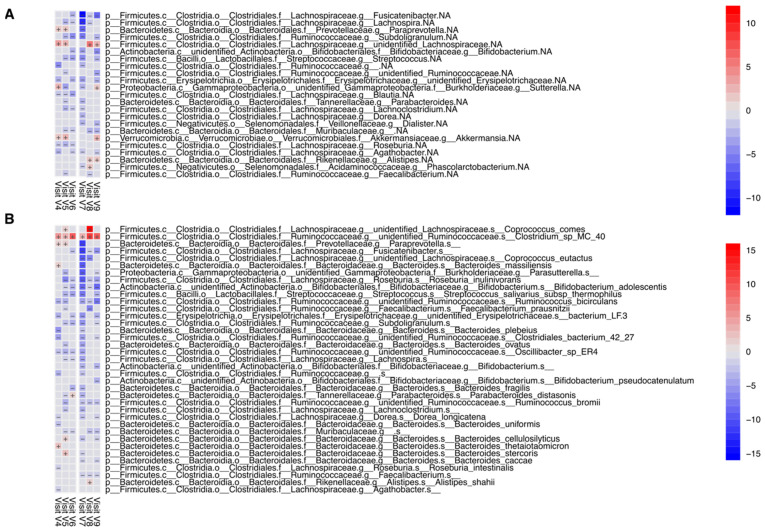
Figure 4.
Analysis for differential abundance of bacterial taxa at the genus (A) and species (B) levels. Blue and red squares depict coefficients of significantly differential abundance for every week of the trial, grey squares represent non-significance (Maaslin2 linear mixed model, q-value < 0.25, p value < 0.05; detailed results provided in Table S1).

