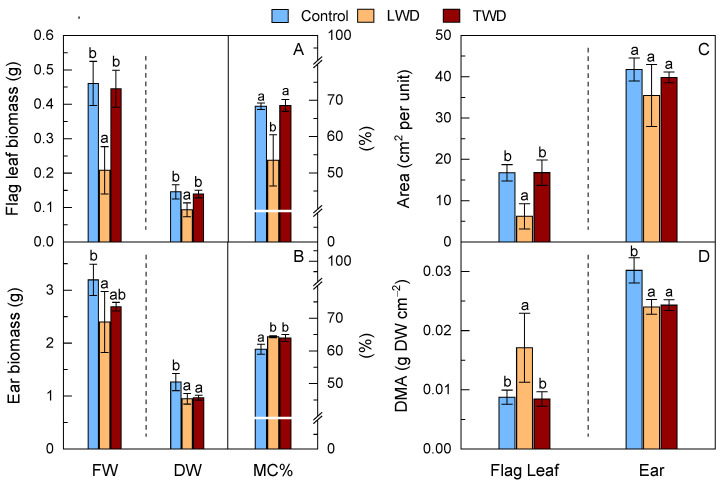
Figure 2.
Effect of two water deficit treatments under combined elevated CO2 and high temperature on the fresh weight (FW), dry weight (DW) biomass and moisture content percentage (MC%) of flag leaf (Panel A) and ear (Panel B), green area per organ unit (Panel C) and dry matter per unit of area (DMA) (Panel D) of potted wheat plants. Means of data from control (blue bars), long water deficit (LWD, orange bars) and terminal water deficit (TWD, dark red bars) are plotted together with the standard deviation (SD). Different letters above the bars (a and b) indicate statistically significant differences among treatments for each organ after post-hoc test analyses (p-value ≤ 0.05, n = 4, see Spreadsheet S1, Treatments).

