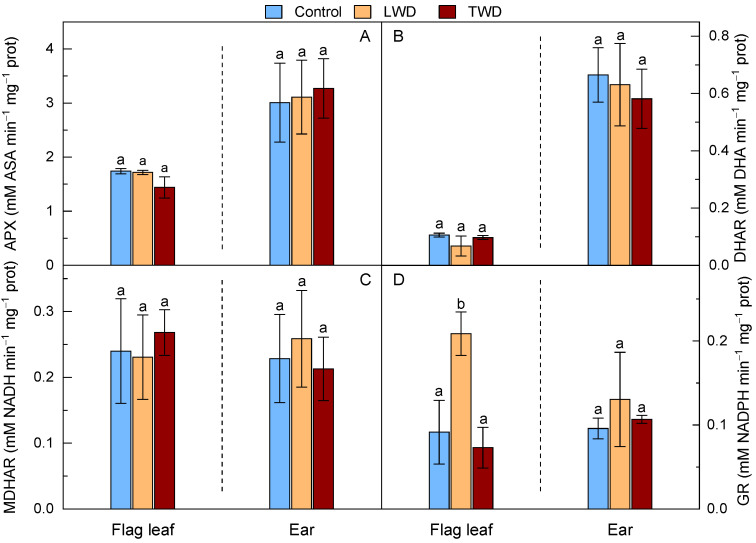
Figure 6.
Effect of two water deficit treatments under combined elevated CO2 and high temperature on ascorbate peroxidase (APX) (Panel A), dehydroascorbate reductase (DHAR) (Panel B), monodehydroascorbate reductase (MDHAR) (Panel C) and glutathione reductase (GR) (Panel D) activities in flag leaf and ear of potted wheat. Legend is as described in Figure 2. Bars represent mean values ± SD. Different letters above the bars (a and b) indicate statistically significant differences among treatments for each organ after post-hoc test analyses (p-value ≤ 0.05, n = 4, see Spreadsheet S1, Treatments).

