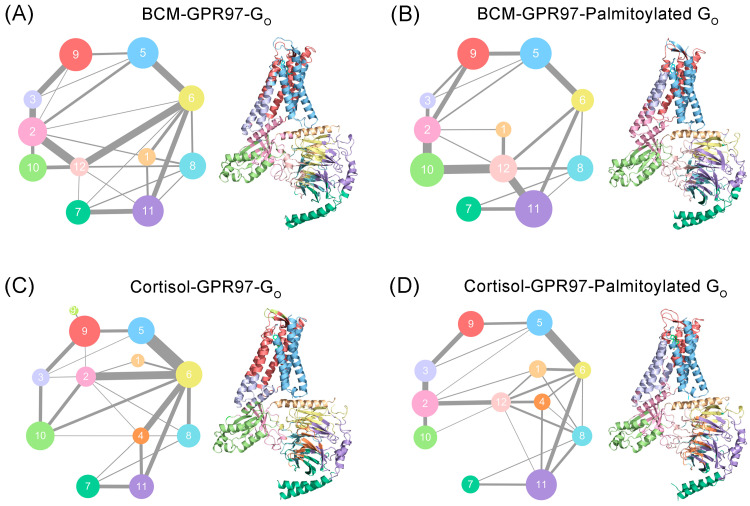
Figure 8.
Colored community networks of BCM–GPR97–Go (A), BCM–GPR97–palmitoylated Go (B), cortisol–GPR97–Go (C), and cortisol–GPR97–palmitoylated Go (D). Each sphere represents an individual community with an area proportional to the number of residues it contains. The lines connecting different spheres visualize the intercommunity connections, while the thickness of the lines is proportional to the corresponding edge connectivity.

