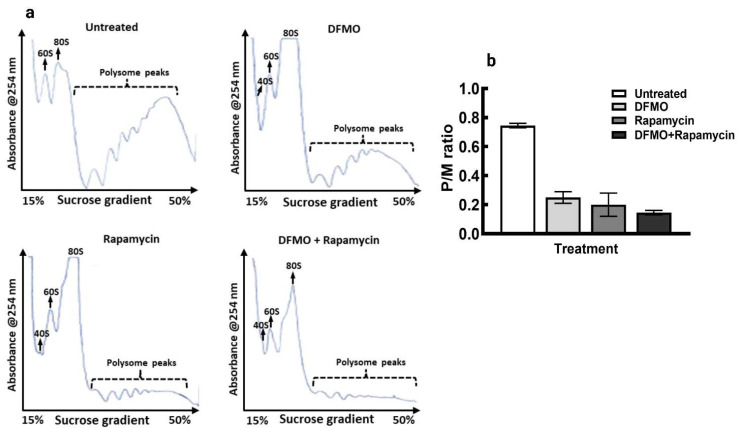
Figure 6.
Polysome profile analysis of MCF-7 cells following treatment with DFMO and Rapamycin and the combination of both. Representative of polysome profiles of cells grown for 72 h with no treatment (top left), cells grown for 24 h followed by 5mM DFMO treatment for 48 h (top right), cells grown for 24 h followed by treatment with 0.1 µM rapamycin for 48 h (bottom left), and cells grown for 24 h followed by 5 mM DFMO plus 0.1 µM rapamycin treatment for 48 h (bottom right). Cells were harvested and processed for polysome analysis, (a) Images for each treatment shown is a representation for two independent experiments. (b) Estimation of polysome to monosome ratio from (a). Values shown are mean ± range for two independent experiments for all treatments.

