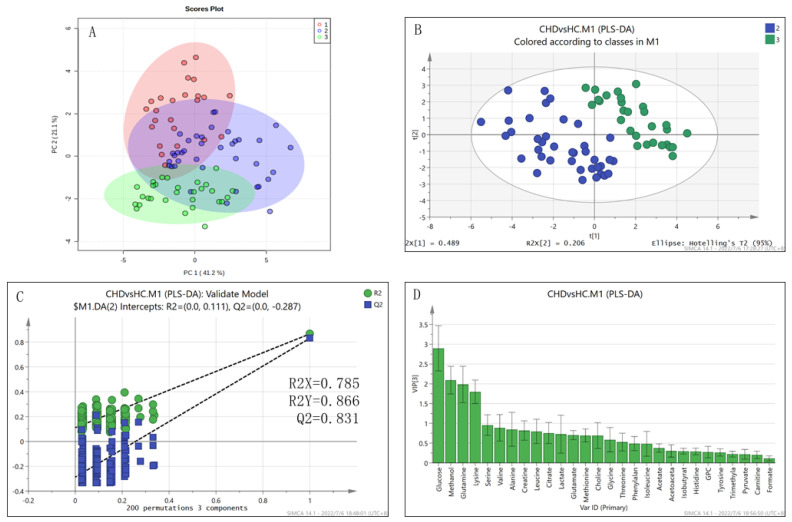
Figure 1.
Multivariate statistical analysis of metabolite levels for the CHD and HC groups. (A) Unsupervised PCA scores plot of all samples. The PAH−CHD, CHD and HC groups of samples are marked in red, blue and green, respectively; (B) Supervised PLS−DA scores plot of CHD (blue) vs. HC (green); (C) Robustness of the PLS−DA model validated by RPTs with 200 cycles; (D) VIP values of metabolites calculated from the PLS−DA model.

