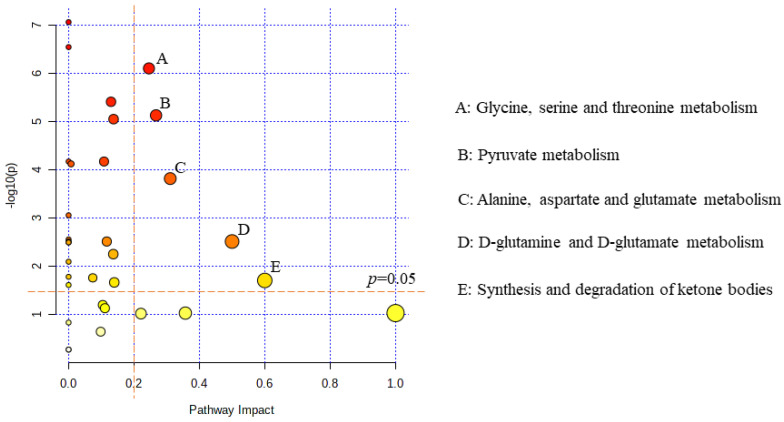
Figure 3.
Metabolic pathway analysis for identifying significantly altered metabolic pathways in the PAH−CHD group relative to the CHD group. The vertical orange dashed line corresponds to the pathway impact value of 0.2 while the horizontal dashed line corresponds to the value of −log10(p) where p is equal to 0.05.

