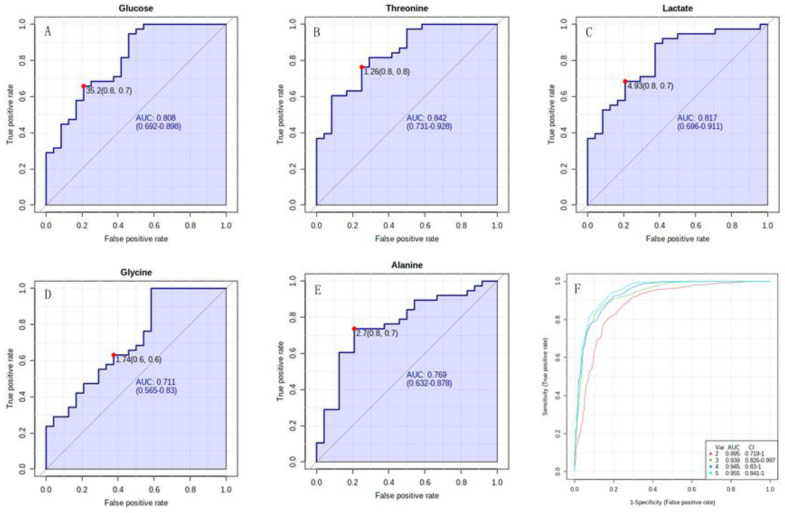
Figure 4.
The ROC curve analyses of PAH−CHD vs. CHD. (A–E) Univariate ROC curves of five characteristic metabolites for distinguishing PAH−CHD from CHD; (F) Multivariate ROC curve of the combination of more than two characteristic metabolites. Each curve corresponded to each combination of different number of characteristic metabolites.

