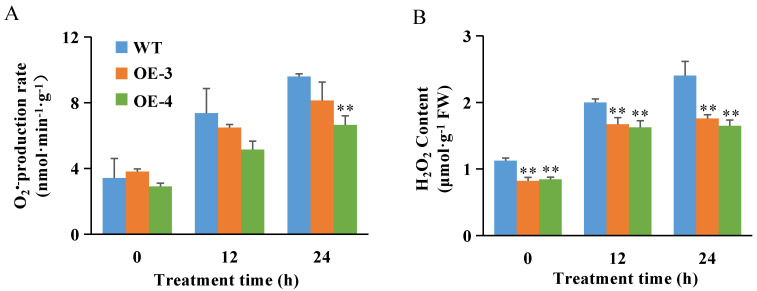
Figure 2.
Changes of reactive oxygen species (ROS) in roots of various rice plants under salt stress. O2•− production rate (A) and H2O2 content (B) in roots of two–week–old OsABT–OE lines (OE–3 and OE–4) and WT plants under 200 mM NaCl for 0, 12, and 24 h. Data are means ± SD of three independent experiments. Asterisks indicate significant differences compared to WT plants at ** p < 0.01 (Student’s t–test).

