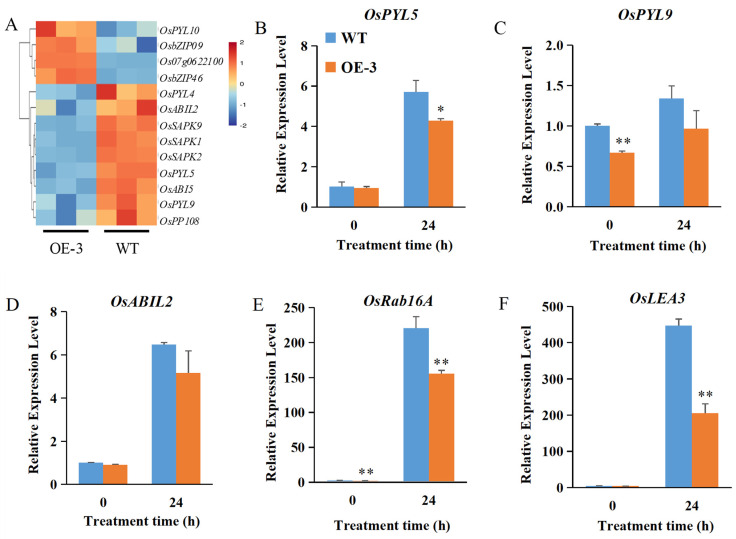
Figure 6.
OsABT negatively regulates ABA signal transduction pathway. (A) Cluster analysis of differentially expressed genes (DEGs) in ABA signal transduction between OE–3 and WT at 24 h of salt treatment. Each column in the figure represents a sample, and each row represents a gene. Log2 processing was performed on the fragments per kilobase of exon per million mapped fragments (FPKM) value of these DEGs. (B–F) Root expression levels of ABA–related genes in 2–week–old OsABT–OE line (OE–3) and WT plants. Root RNA was isolated and used for qRT–PCR. Actin was used as an internal control. The relative expression levels were represented by fold change relative to the WT expression levels before salt treatment (0 h). Data are means ± SD of three independent experiments. Asterisks indicate significant differences compared to WT at * p < 0.05 and ** p < 0.01 (Student’s t–test).

