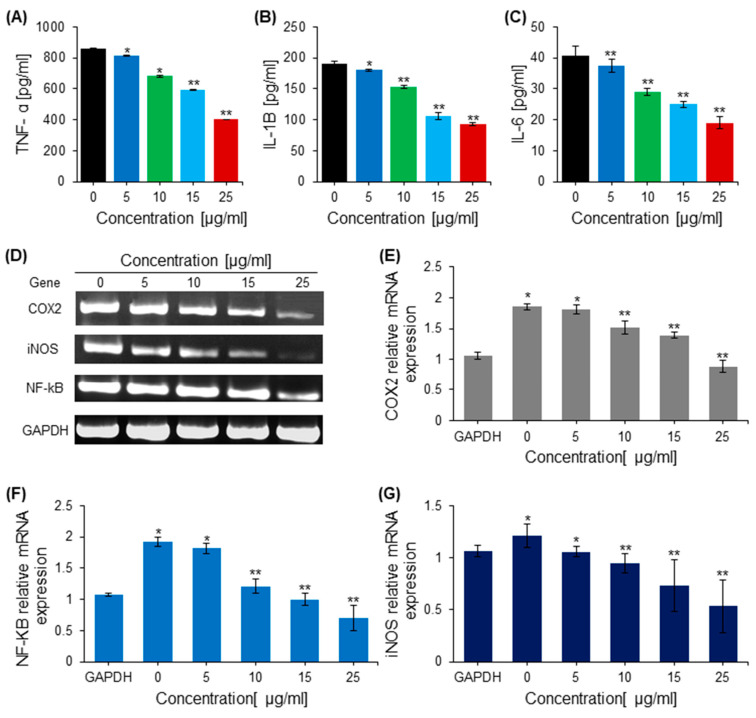
Figure 6.
The anti-inflammatory effect of saponins. (A) Quantification of Tumor necrosis factor alpha (TNF-α) in cells treated with various concentrations of saponins. (B) The effect of saponins on the release of the pro-inflammatory cytokine interleukin-1β (IL-1β), quantified in control and treated cells with an ELISA. (C) The effect of saponins on the release of the proinflammatory cytokine IL-6, quantified in control and treated cells with an ELISA. (D) The DNA bands of inflammation-related genes from the RT-PCR. (E). The relative mRNA expression of the pro-inflammatory gene COX-2 in treated and control cells determined by RT-PCR. (F) The relative mRNA expression of the pro-inflammatory gene NF-kB in treated and control cells determined by RT-PCR. (G) The relative mRNA expression of the pro-inflammatory gene iNOS in treated and control cells determined by RT-PCR. * = p < 0.001, ** = p < 0.001 compared with the control.

