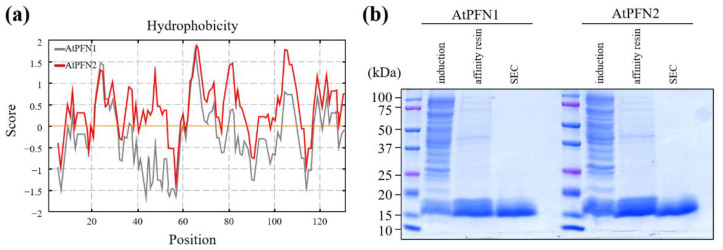
Figure 1.
Comparison of the hydrophobicity of AtPFN proteins and their purification from E. coli. (a) The Kyte-Doolittle analysis generated hydrophobicity plots of AtPFN1 (gray) and AtPFN2 (red). The y-axis indicates the hydrophobicity scores; positive scores on the y-axis indicate hydrophobic regions. (b) Recombinant AtPFN1 and AtPFN2 were isolated via E. coli expression, and purity was confirmed using 13% SDS-PAGE and Coomassie blue staining. Induction, IPTG induced total proteins; affinity resin, a soluble protein purified by an affinity column; SEC, pure protein fractionated from SEC.

