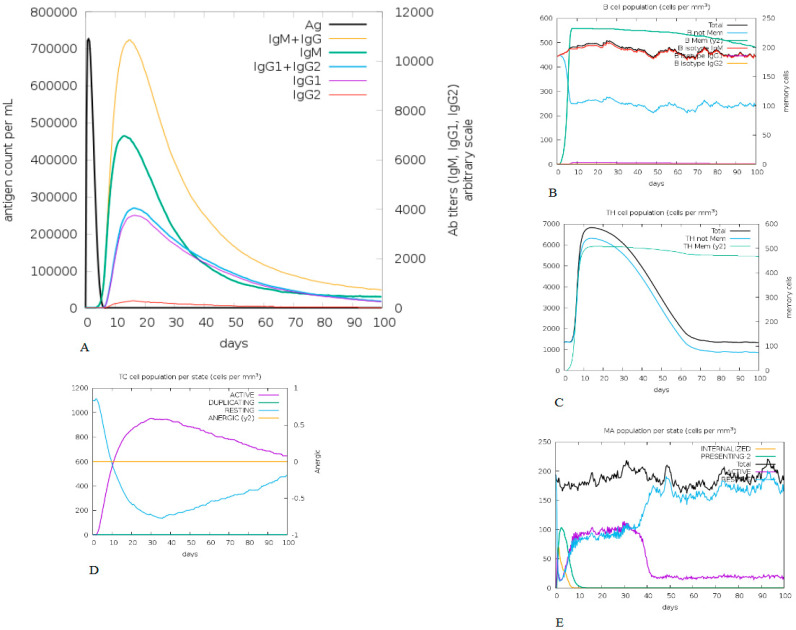
Figure 5.
Immune simulation profile of constructed vaccine. (A) Exhibits both the relative antibody responses and antigen concentration and the presence of protective IgGs indicates that the vaccination was effective. (B) Depicts the relevant number of antibody-producing plasma cells. (C–E) Presents the activity of macrophages cytotoxic T and helper T cells.

