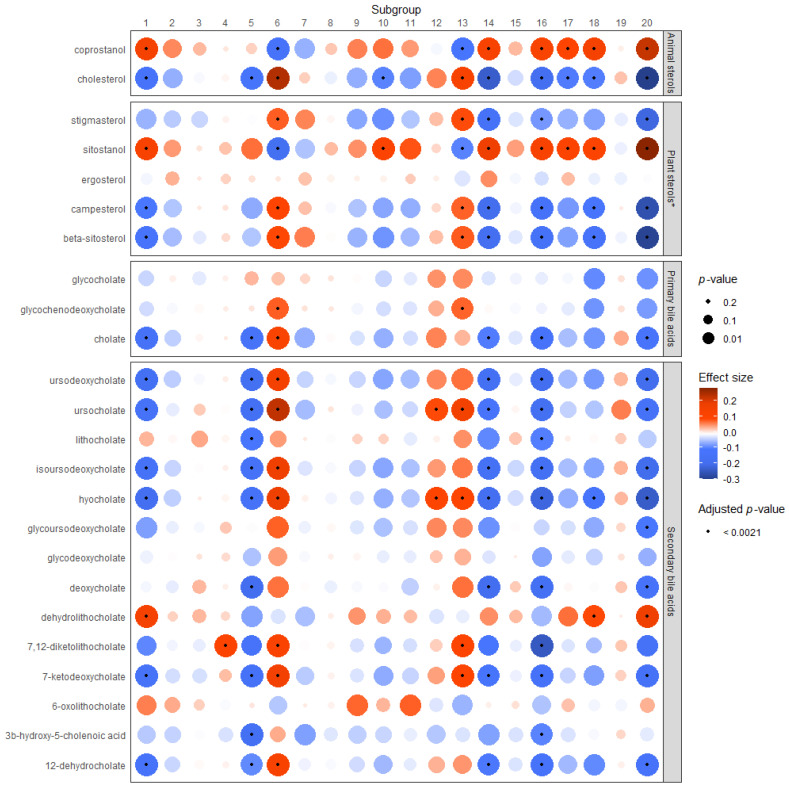
Figure 2.
Associations between microbial subgroups and fecal bile acids or sterols. * The linear trend is shown here. However, these models indicate the presence of a non-linear relationship, which cannot be represented in the heat map. Supplementary Figures S2–S6 depict the non-linear relationship for each plant sterol and subgroup in comparison to the linear trend shown here.

