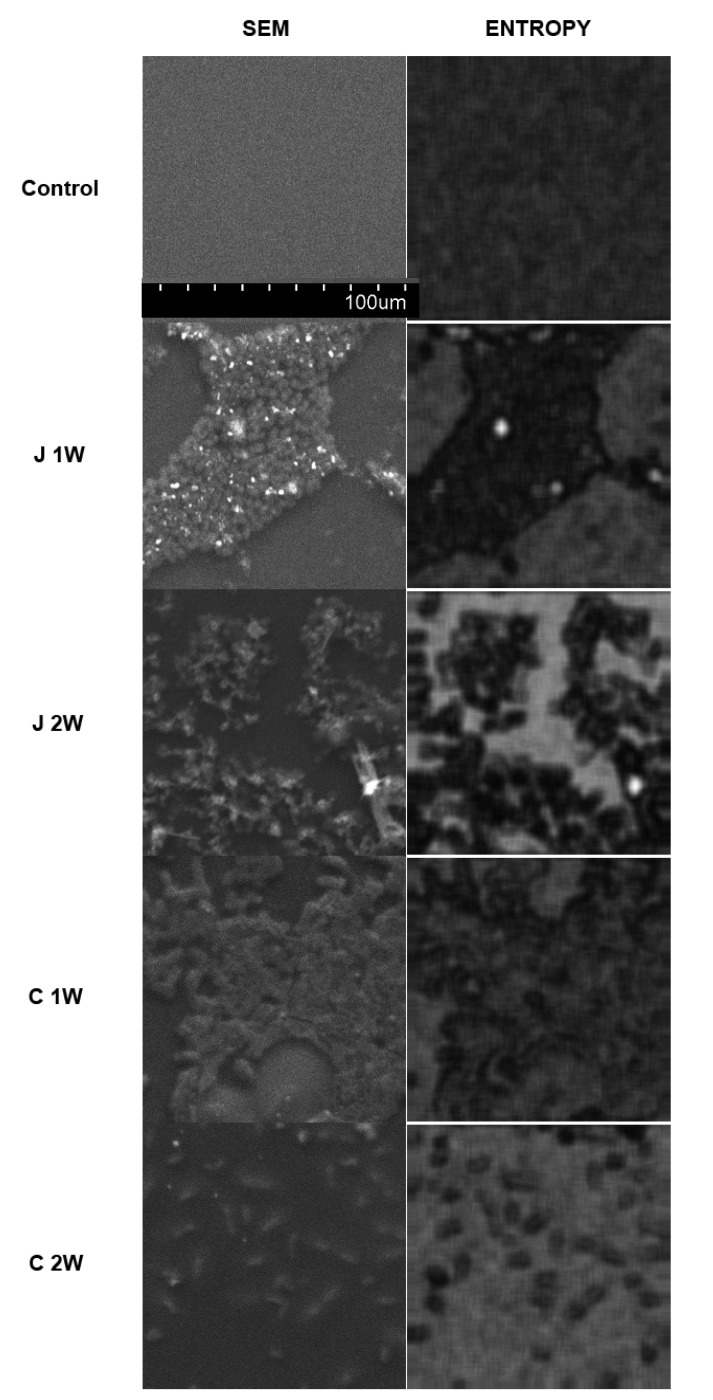
Figure 2.
Investigation of surface structures on orthodontic alignments using digital texture analysis. The left column shows images from scanning emission microscopy (SEM). The right column shows intensity maps of chaotic and nonorganized structures (Entropy)—the brighter the local areas, the higher the entropy of the site. In these maps, textures with organized structure have low entropy (dark fields) because their structure is not chaotic.

