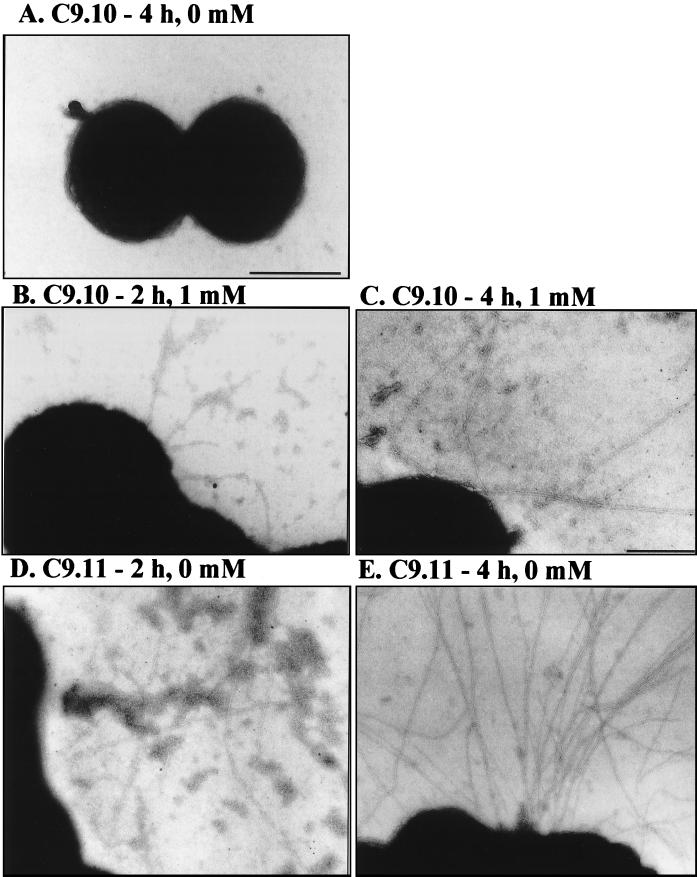
FIG. 4.
TEM images of negatively stained C9.10 and C9.11 over a time course of pilus induction. (A) C9.10 after 4 h of growth without IPTG. (B) C9.10 after 2 h of growth with 0.5 mM IPTG. (C) C9.10 after 4 h of growth with 1.0 mM IPTG. (D) C9.11 after 2 h of growth without IPTG. (E) C9.11 after 4 h of growth without IPTG. A typical cell from the grid is shown in each panel. The bar represents 0.5 μm in panels A, B, D, and E and 0.25 μm in panel C.

