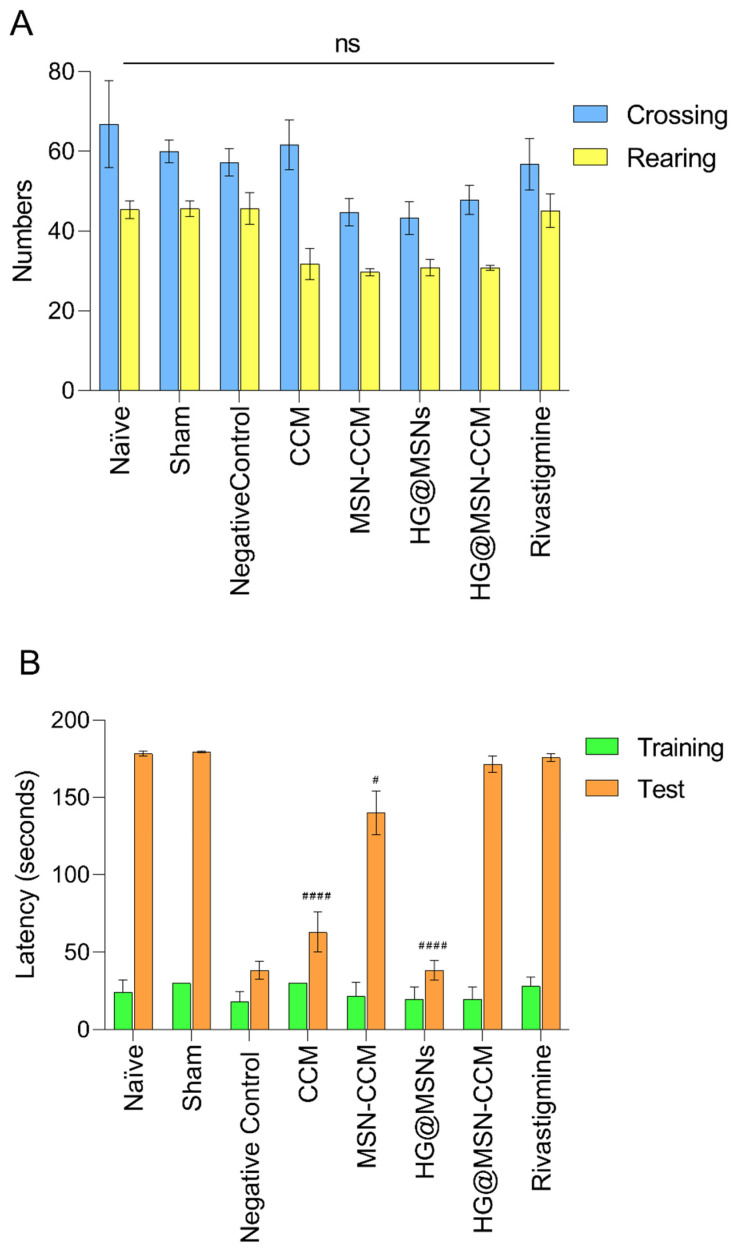
Figure 9.
In vivo assay. Effects of treatment in the open field test (A) and inhibitory avoidance (B). Each bar represents the mean ± SD, from 6 to 12 animals per group. # p < 0.05, and #### p < 0.0001. The data were analyzed by the analysis of variance (ANOVA) and complemented by the Dunnett’s post hoc tests. ns = non-significant.

