Figure 1.
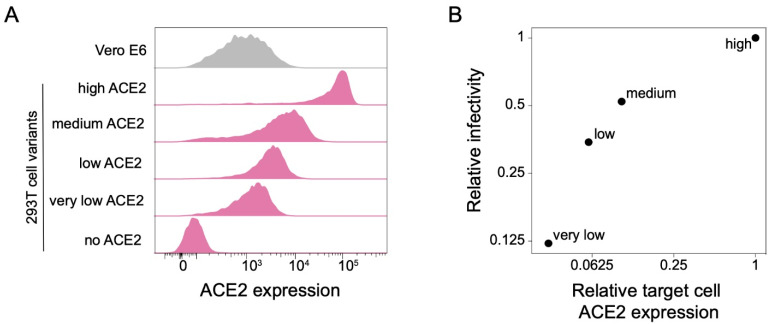
293T cell clones expressing ACE2 at different levels. (A) ACE2 expression in 293T cells engineered to express different levels of ACE2. ACE2 surface expression was measured by flow cytometry, and the histograms show the distribution of expression levels over a population of cells. Vero E6 cells are included for comparison. (B) Relationship between ACE2 expression in the four 293T target cell clones and infection by lentiviral particles pseudotyped with the SARS-CoV-2 D614G spike.

