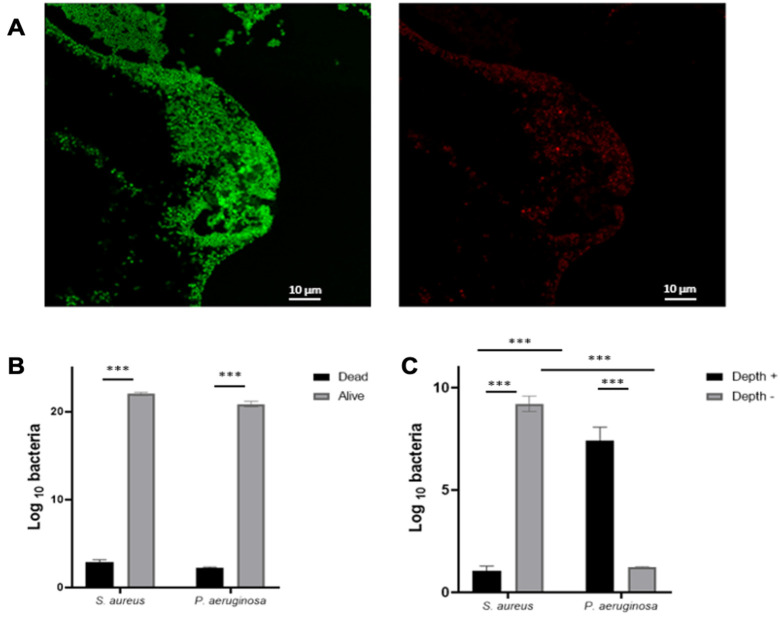
Figure 2.
Spatial distribution of a mixed biofilm with S. aureus and P. aeruginosa inside the BioFluxTM 200 system. S. aureus SAC2 was cocultured 1:1 with P. aeruginosa PAC2 cells. Cells were stained with PI/Syto9 and fixed after three days of coculture and confocal microscopy was performed to show Syto9 bacteria (alive = green; (A), left) and PI bacteria (dead = red; A, right) and stained bacteria were quantified (B). Images taken from the deepest part of the biofilm and the surface of the P. aeruginosa/S. aureus biofilm were quantified (C). Results are presented as the mean ± standard deviation of three different experiments. Statistics were performed using a t-test on GraphPad Prism version 9.2. *** p < 0.001.

