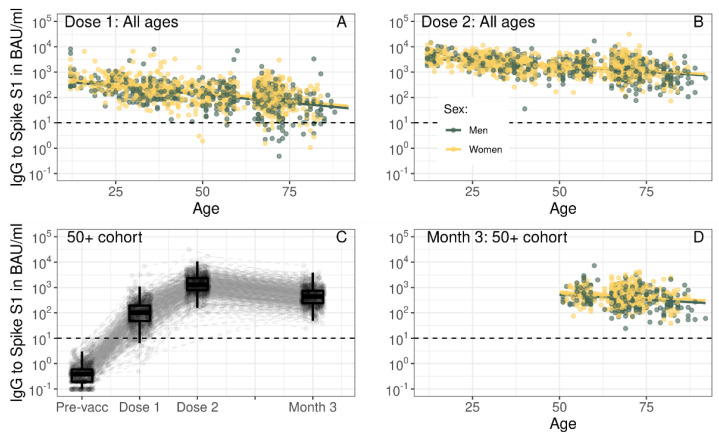
Figure 3.
Spike S1-specific IgG by age in years per time point (A,B,D) and kinetics following the primary series of BNT162b2 vaccination in infection-naive participants up to three months following the second vaccination dose (C). In (A,B,D), fitted lines represent the linear association between IgG concentration and age from linear mixed effects regression results (Table 1), while dots represent individual measurements. Results are shown separately for males (green) and females (yellow). In (C), boxplots show results for all participants at each time point, while dots and dashed grey lines show measurements and their trajectory between time points per participant. In (A–D), Spike S1 IgG concentrations were expressed in international binding antibody units (BAU) using the 20/136 NIBSC standard and were taken prior to vaccination (Pre-vacc), one month following the first (Dose 1), one month following the second (Dose 2), or three months following the second vaccination dose (Month 3). In (A,B), results are shown for total of 1448 unique infection-naive participants across all ages with S1 IgG measurements available at Dose 1 and/or Dose 2, while in (C) results are shown for 749 unique infection-naive participants in the 50+ cohort and in (D) results are shown for 725 unique infection-naive participants in the 50+ cohort with measurements available at Dose 2 and/or Month 3. The horizontal dashed line represents the threshold for seropositivity to Spike S1. IgG: immunoglobulin G; BAU: binding antibody units.

