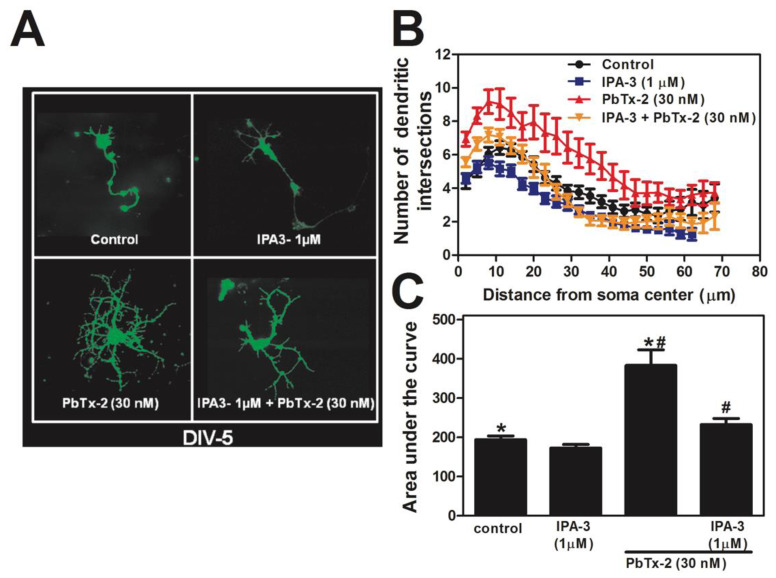
Figure 10.
PbTx-2 enhancement of dendritic complexity requires PAK1. Representative images of DIV 5 neurons (A). Sholl analysis, performed by IMARIS software, of DIV 5 neurons treated with ± PbTx-2 alone or with the Pak1 inhibitor IPA-3 (B). Histogram summary (mean ± SEM) for the area under the curve analysis of Sholl data (C). The experiment was performed two times with independent cultures, and 25 to 30 neurons were quantified for each exposure condition. (* one-way ANOVA, followed by Dunnett’s multiple comparison test, with control p < 0.05; # one-way ANOVA, followed by Dunnett’s multiple comparison test, with PbTx-2 30 nM p < 0.05).

