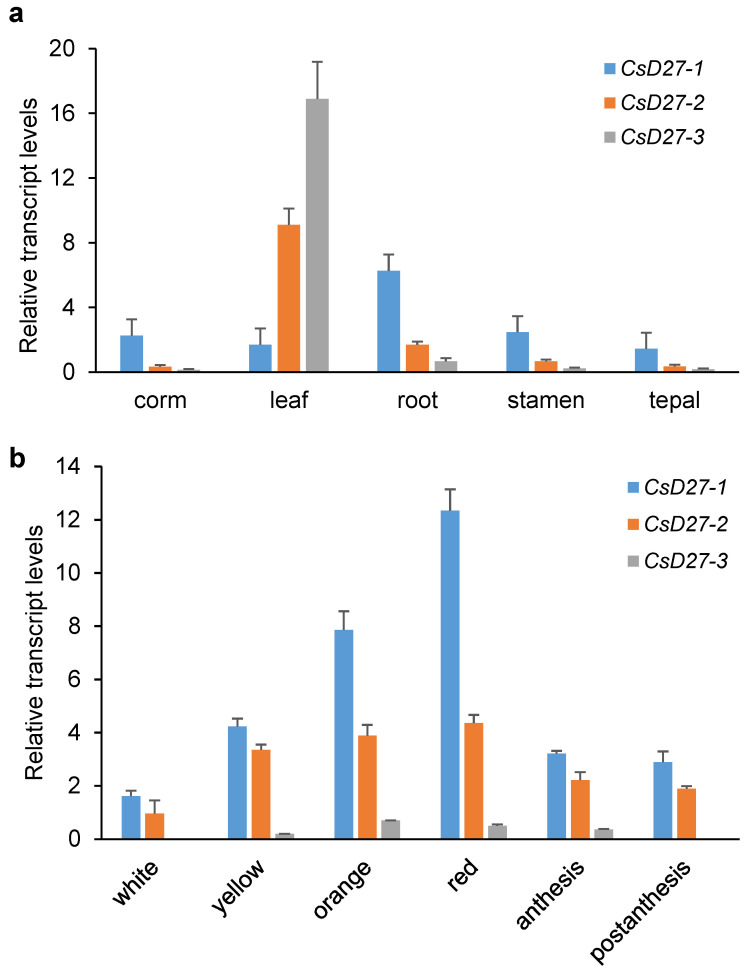
Figure 4.
Relative expression levels of CsD27-1, -2 and -3 in vegetative and reproductive tissues investigated by qRT-PCR. (a) Transcripts levels in corm, leaf, root, stamen and tepal. (b) Expression levels in six developmental stages of the stigma. Bars represent mean ± SD (n = 3 biological replicates).

