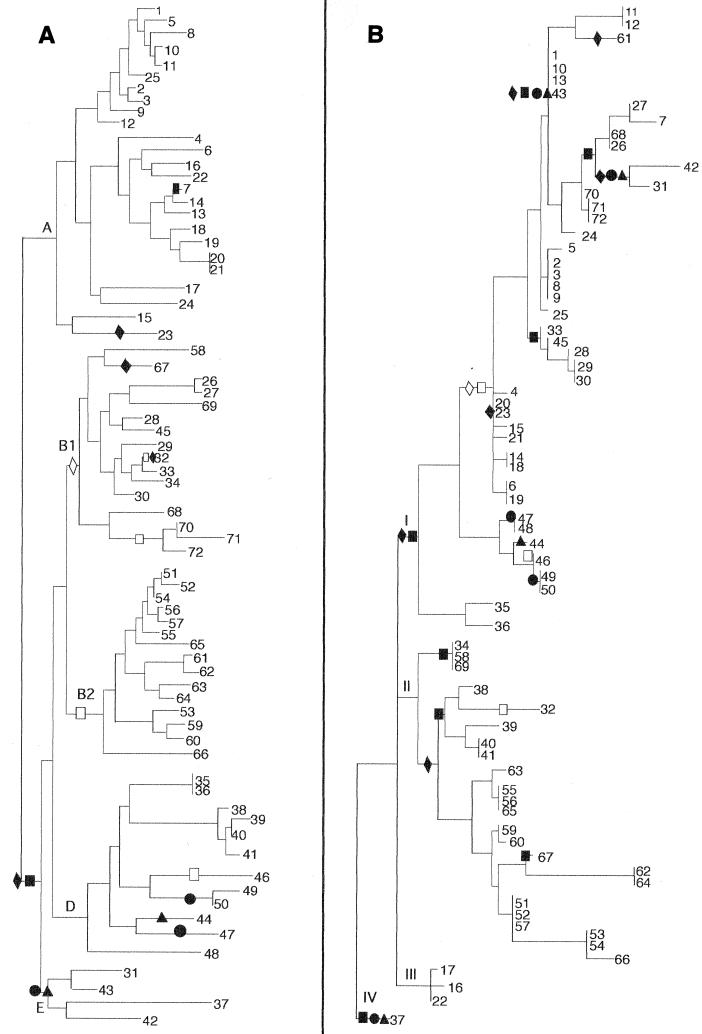
FIG. 5.
Phylogenetic distributions of four mutS-rpoS region sequences mapped onto E. coli MLEE and mutS phylogenies. Hybridization data were optimized on the (A) MLEE and (B) mutS trees according to the principle of maximum parsimony. The optimization scheme shown represents the most parsimonious scenario for the evolution of these four sequences. In clades for which equally parsimonious optimizations exist, the accelerated transformation scheme is presented (21). Probe sequences are represented on the trees by the following symbols: ▴, MRJR; ●, BL129; ■, BL148; and ⧫, F23. The presence of a symbol represents a single evolutionary transformation (step). Shaded symbols represent the gain of specific sequences along the indicated lineage, while open symbols mark the loss of the sequence from a clade.

