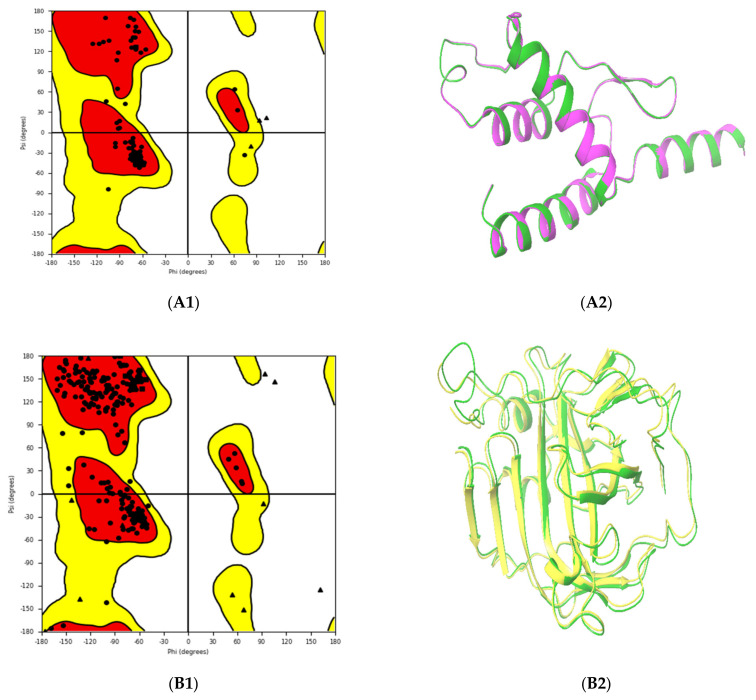
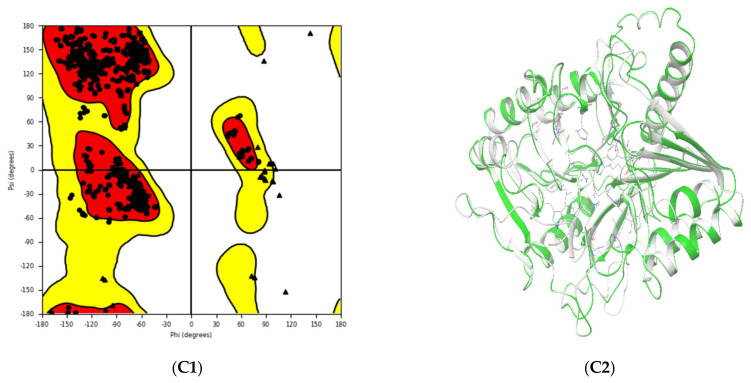
Figure 2.
Ramachandran plots of the generated protein structures (Left). The red colors in the Ramachandran plots indicate the most allowed regions; the generously allowed regions are shown in yellow, and the disallowed regions are shown in white. The triangles indicate glycine, the squares indicate proline, and all other residues are plotted as circles. On the right of the figure, the superimposition of the generated structures in 3D (green) with those of reference proteins that were used as a template for the model generation is shown; their PDB IDs are: 6RFL_C (violet), 4E9O_A (yellow), and 7E0M_A (white). (A). DNA-Dependent RNA Polymerase subunit (A6R), (B). Carbonic anhydrase (GAG-binding IMV membrane protein) (D8L), (C). Palmitoylated extracellular enveloped virus (EEV) membrane glycoprotein (F13L).


