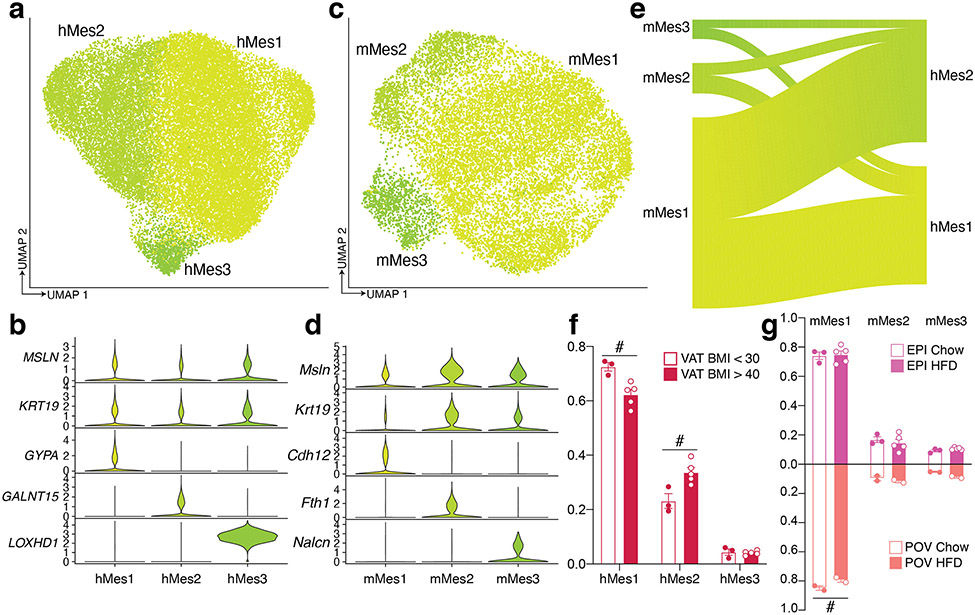
Extended Data Fig. 6. Subpopulations of human and mouse mesothelial cells.
a, UMAP projection of 30,482 human mesothelial cells. b, Marker genes for distinct human mesothelial populations. c, UMAP projection of 14,947 mouse mesothelial cells. d Marker genes for distinct mouse mesothelial populations. e, Riverplots showing relationship of mouse and human mesothelial clusters. f-g, Proportion of cells in each cluster per sample, split by BMI for human (f) and diet and sex for mouse (g). For humans, n = 3 VAT < 30, and 5 VAT > 40. For male mice n = 3 EPI Chow, and 5 EPI HFD. For female mice, n = 2 per condition. Error bars represent SEM, # indicates credible BMI/diet effect, calculated using hMes3 (human) and mMes1 (mouse) as reference.

