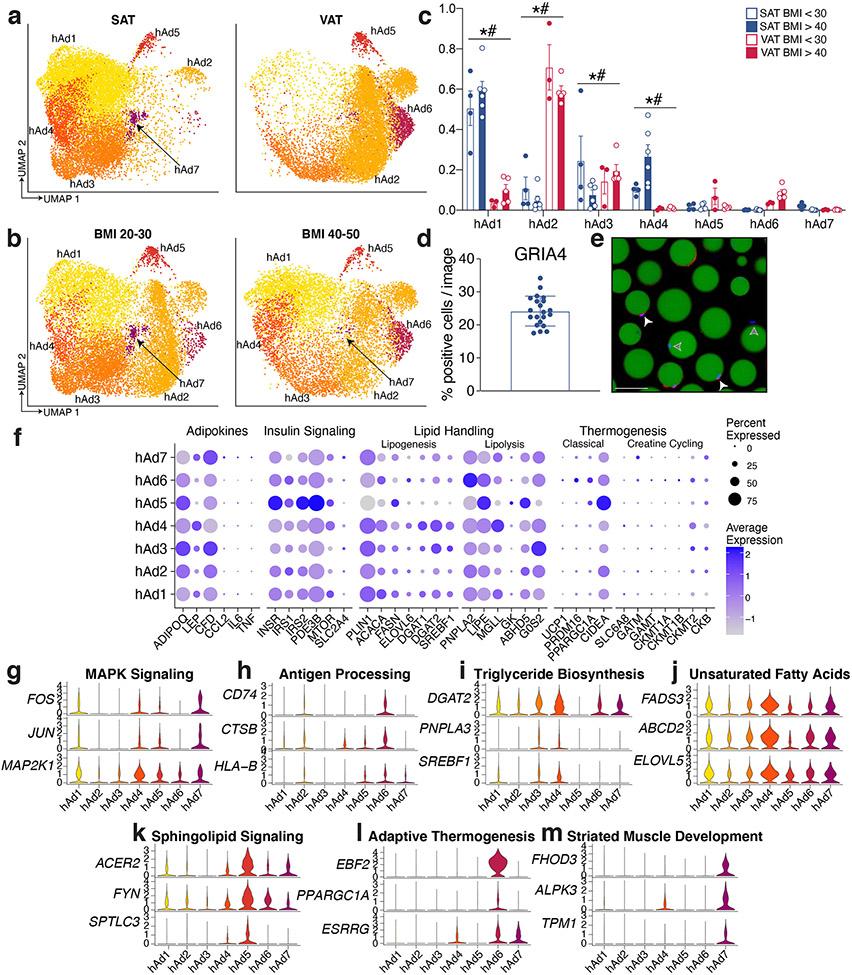
Extended Data Fig. 9. Human adipocyte subtypes are highly dependent on depot and may be responsible for distinct functions.
a-b, UMAP projections of human white adipocytes split by depot (a) and BMI (b). c, Proportion of cells in each human cluster by sample split by depot and BMI, n = 4 SAT < 30, 6 SAT > 40, 3 VAT < 30, and 5 VAT > 40. D, Quantification of immunofluorescence analysis of GRIA4+ cells in mature human adipocytes from two individuals. Each dot represents an image, n = 12 images from individual 1 and 9 images from individual 2 with a total of 704 counted cells. Only cells with visible nuclei were included in the quantification. e, Representative image of GRIA4+ cells, white arrows represent positive cells, grey represent negative, scale bar = 100 μm. In total, there were 21 images from samples taken from two individuals. f, Expression of genes associated with adipokine secretion, insulin signaling, lipid handling, and thermogenesis across human adipocyte subclusters. g-m, Expression of genes associated with GO or KEGG pathways indicative of individual human adipocyte subclusters. For bar graph, error bars represent SEM, * indicates credible depot effect and # indicates credible BMI effect, calculated using hAd5 as reference.

