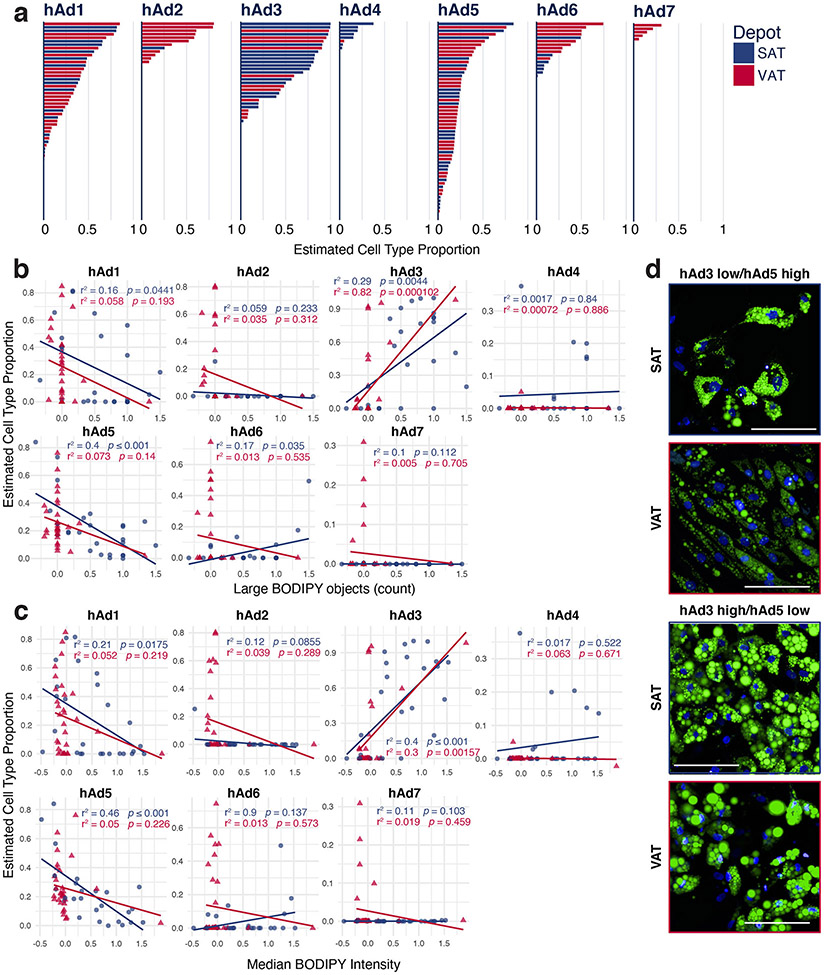
Extended Data Fig. 10. Human adipocytes differentiated ex vivo recapitulate many of the adipocyte subclusters found in vivo.
a, Plot of estimated cell type proportion in ex vivo adipocyte cultures differentiated from subcutaneous or visceral preadipocytes for 14 days, ordered by estimated proportion. b-c, Scatterplots showing the relationship between estimated cell type proportion and the LipocyteProfiler-calculated features Large BODIPY objects (b) and Median BODIPY Intensity (c). p values were calculated using an F-test with the null hypothesis that the slope = 0. d, Representative images of hAd3 low/hAd5 or hAd3 high hAd5 low ex vivo differentiated cultures. Green represents BODIPY staining, blue represents Hoechst staining. Scale bars are 100 μm, in total, 3 randomly selected images/sample were analyzed from 3 SAT samples and 3 VAT samples with the lowest and highest predicted proportions of hAd3 and hAd5.

