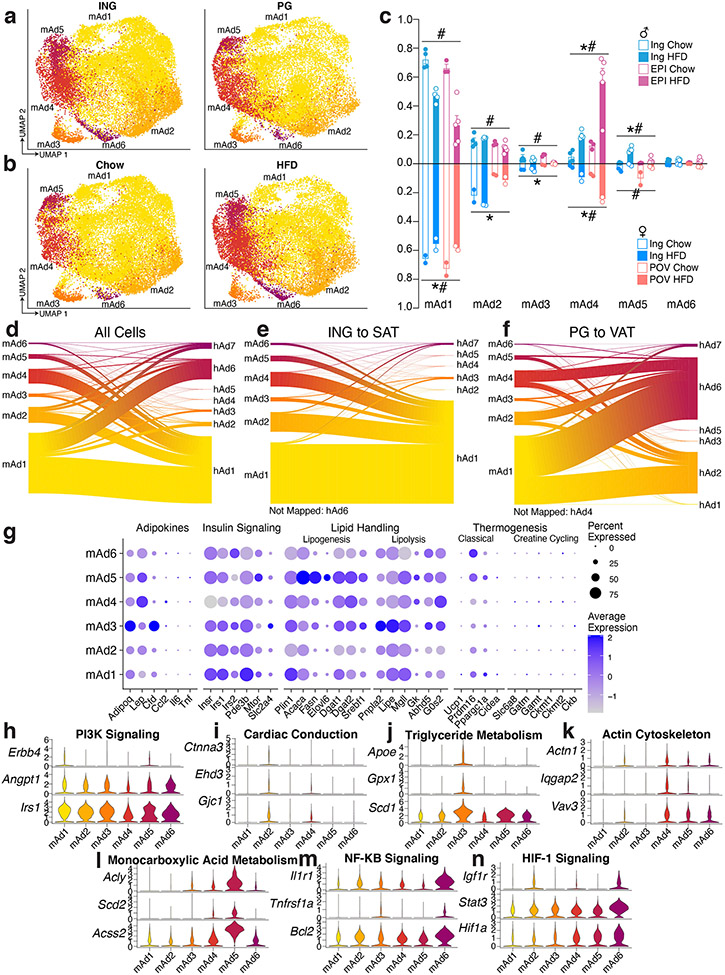
Extended Data Fig. 12. Mouse adipocytes appear to have distinct functionality but are not analogous to human adipocyte subpopulations.
a-b, UMAP projections of mouse adipocytes split by depot (a) and diet (b). c, Proportion of cells in each mouse cluster per sample split by depot, diet, and sex. For male mice n = 4 ING Chow, 4 ING HFD, 3 EPI Chow, and 5 EPI HFD. For female mice, n = 2 per condition. d, Expression of genes associated with known adipocyte functions in mouse adipocyte subclusters. e-k, Expression of genes associated with GO or KEGG pathways indicative of individual mouse adipocyte subclusters. l-n, Riverplots of mouse cells showing the association between mouse and human adipocyte clusters from both subcutaneous and visceral depots (l), subcutaneous (ING and SAT) adipocytes only (m) or visceral (PG and VAT) adipocytes only (n). For depot comparisons, both mouse query objects and human reference objects were subset to the respective depot before mapping. For bar graph, error bars represent SEM, * indicates credible depot effect and # indicates credible diet effect, calculated using mAd6 as reference.

