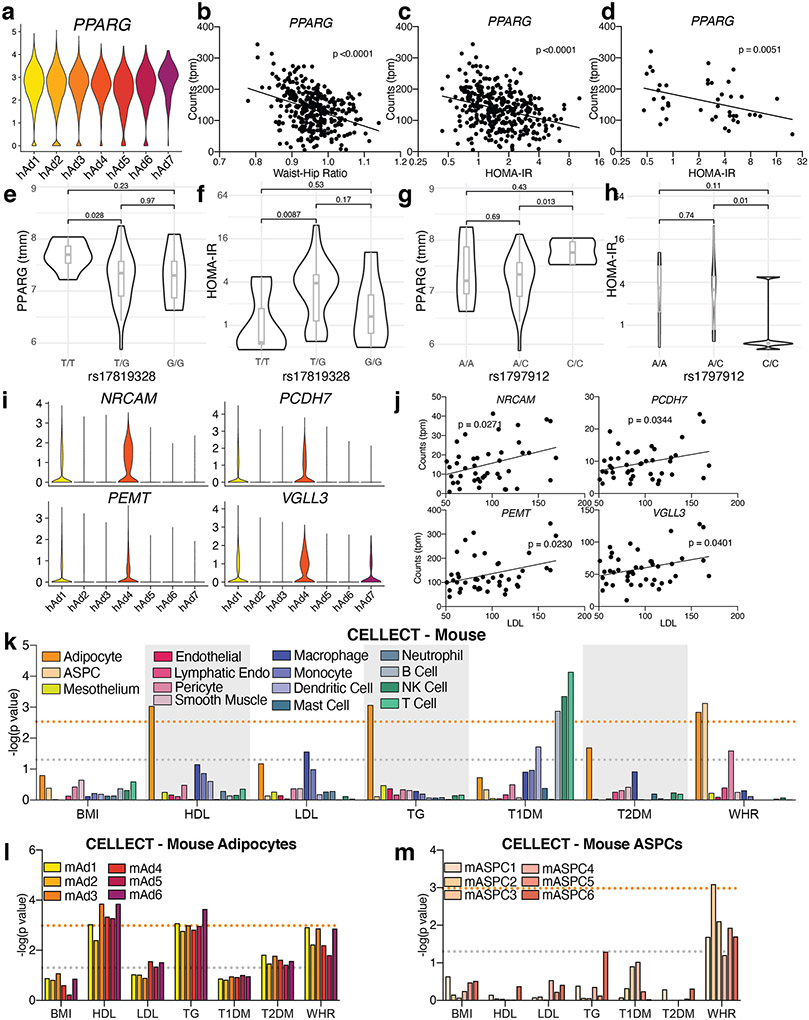
Extended Data Fig. 14. Association with GWAS data provides further insight into the contribution of white adipocytes to human traits.
a-c, Expression of PPARG in human adipocyte subclusters (a), and in METSIM SAT bulk RNA-seq plotted against WHR (b) or HOMA-IR (c). d, Expression of PPARG in isolated subcutaneous adipocyte bulk RNA-seq plotted against HOMA-IR. e-h, SNPs in the PPARG gene identified by DEPICT as associated with BMI-adjusted WHR plotted against PPARG gene expression (e, g) and HOMA-IR (f, h) in isolated subcutaneous adipocyte bulk RNA-seq data and cohort. For rs17819328 n = 7 for T/T, 30 for T/G, and 6 for G/G. For rs1797912 n = 7 for A/A, 31 for A/C, and 5 for C/C. For box plots, horizontal line = median, lower and upper bounds of the box = 1st and 3rd quartile respectively, lower and upper whisker = 1st quartile – 1.5 x interquartile range (IQR) and 3rd quartile + 1.5 x IQR respectively. p values were calculated using a Wilcoxin test. i-j, Expression of genes in human adipocyte subtypes from sNuc-seq data (i) and from isolated subcutaneous adipocyte bulk RNA-seq plotted against LDL (j). k, p values of the association between mouse cell types and GWAS studies. l-m, p values of the association between mouse adipocyte (l) or ASPC (m) subclusters with GWAS studies. For all graphs, the grey line represents p = 0.05 and the orange line represents significant p value after Bonferroni adjustment (p = 0.003 for all cell, p = 0.001 for subclusters), calculated based on number of cell types queried. For scatterplots, p values were calculated using an F-test with the null hypothesis that the slope = 0.

