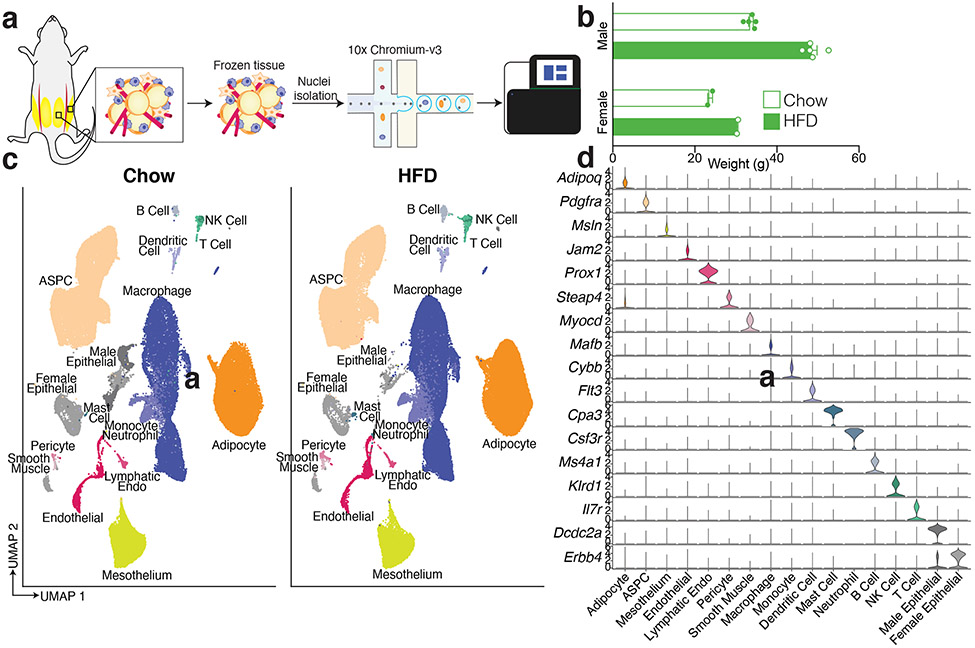
Fig. 2. A single cell atlas of mouse white adipose tissue.
a, Schematic of workflow for sNuc-seq of mouse ING and PG adipose tissue. a, Body weight of chow and high fat fed animals used for sNuc-seq (n = 5 chow and 5 HFD male mice, 2 chow and 2 HFD female mice). Error bars represent standard error of the mean (SEM). c, UMAP projection of all 197,721 sequenced mouse cells split by diet. d, Marker genes for each cell population in the mouse WAT dataset.

