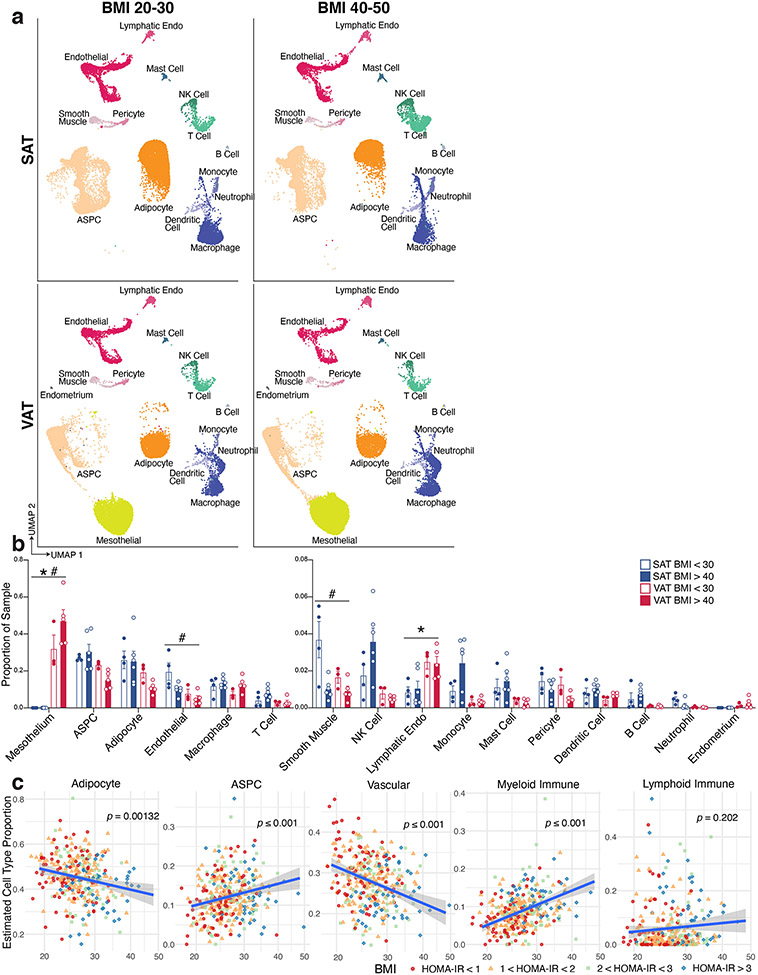
Extended Data Fig. 1. Additional analysis of the effects of depot and BMI on human WAT populations.
a, UMAP projections of cells from the lowest and highest BMI ranges in the dataset, split by depot. To facilitate comparison, samples were randomly subset to contain the same number of cells in each plot (n = 20,339). b, Graph showing the proportion of sNuc-seq cells in each cluster per sample, split by depot and BMI, n = 4 SAT < 30, 6 SAT > 40, 3 VAT < 30, 5 VAT > 40. C, Estimated cell type proportions in bulk RNA sequencing data of subcutaneous adipose tissue from 331 individuals from the METSIM cohort calculated using sNuc-seq data as reference. Vascular cells include endothelial, lymphatic endothelial, pericytes, and smooth muscle cells. Myeloid immune includes macrophages, monocytes, dendritic cells, mast cells and neutrophils, and lymphoid immune includes B cells, NK cells, and T cells. For lines of best fit: Adipocytes R2 = 0.031, ASPCs R2 = 0.034, Vascular R2 = 0.076, Myeloid Immune R2 = 0.13, Lymphoid Immune R2 = 0.0049. For scatterplots, error bands represent a confidence level of 0.95 and p values were calculated using an F-test with the null hypothesis that the slope = 0. For bar graphs, error bars represent SEM, * indicates credible depot effect and # indicates credible BMI effect, calculated using dendritic cells as reference.

