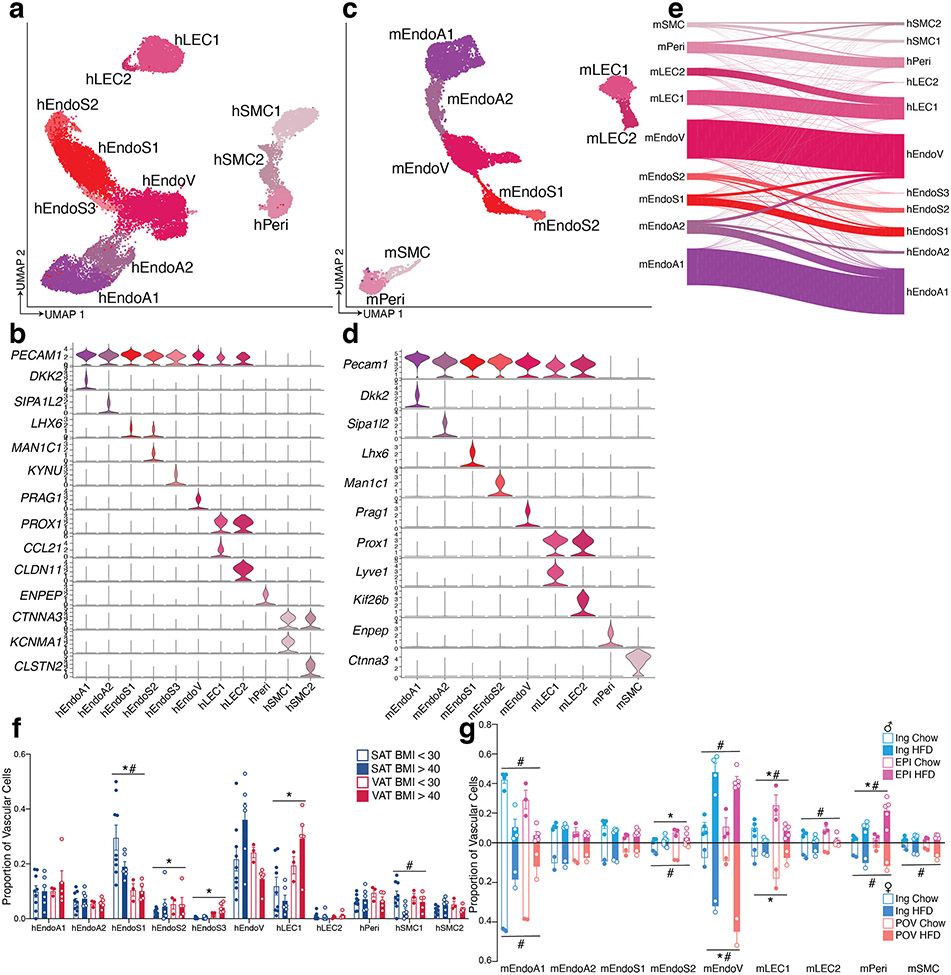
Extended Data Fig. 3. Highly similar vascular cells in human and mouse WAT.
a, UMAP projection of 22,734 human vascular cells. b, Marker genes for 11 distinct clusters of human WAT vascular cells. c, UMAP projection of 7,632 mouse vascular cells. d, Marker genes for 9 distinct clusters of mouse WAT vascular cells. e, Riverplot showing the correlation between annotated mouse and human vascular clusters based on multimodal reference mapping for each mouse cell. f-g, Bar graphs showing the proportion of cells in each cluster per sample split by depot and BMI for human (f) and depot, diet, and sex for mouse (g). For humans, n = 9 SAT < 30, 6 SAT > 40, 3 VAT < 30, and 5 VAT > 40. For male mice n = 4 ING Chow, 4 ING HFD, 3 EPI Chow, and 5 EPI HFD. For female mice, n = 2 per condition. For bar graphs, error bars represent SEM, * indicates credible depot effect and # indicates credible BMI/diet effect, calculated using hEndoA2 (human) and mEndoA2 (mouse) as reference.

