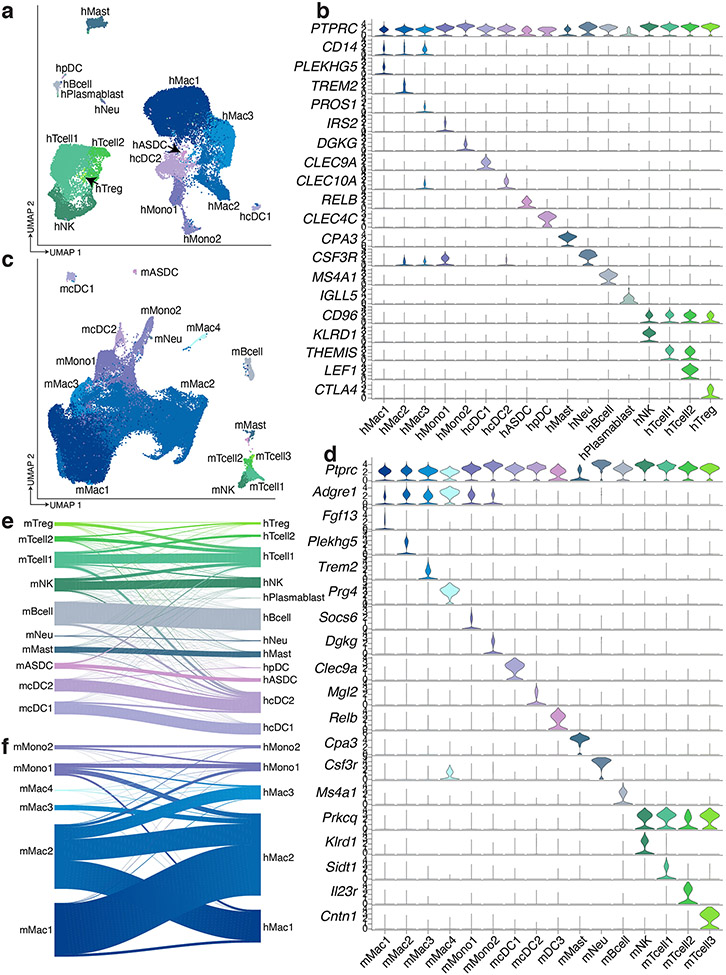
Extended Data Fig. 4. Comparison of immune cells in human and mouse WAT.
a, UMAP projection of 34,268 immune cells from human WAT. b, Marker genes for human immune cell clusters. c, UMAP projection of 70,547 immune cells from mouse WAT. d, Marker genes for mouse immune cell clusters. e-f, Riverplots showing the correlation between annotated mouse cluster and mapped human cluster for mouse (e) dendritic cells, mast cells, neutrophils, B cells, NK cells, and T cells and (f) monocytes and macrophages.

